Research FindingsBack
This questionnaire survey comprised a total of 10 opinion questions, including some follow-up items, and ended by mapping some basic demographics of the respondents. The key findings are summarized below. Cross-references can be made with the frequency tables in Appendix II.
3.1 The survey began by asking all respondents to make a prediction on how many years their MPF funds could support their basic living expenses after retirement. Results showed that 44% were rather conservative by saying 「less than 5 years」, 34% believed their MPF contribution could support their basic expenses for 「5 to 10 years」 after retirement, while a respective of 4% and 3% thought it would be sufficient for 「11 to 15 years」 and 「more than 15 years」. Nonetheless, 16% of them failed to give an estimate. Overall speaking, excluding those invalid answers, respondents thought their MPF funds at retirement could support their basic living expenses for 6.7 years on average (standard error: 0.08 year, Table 4). Also see Figure 1.  3.2 To be sufficient to support their retirement living, a respective of 19% and 18% of respondents believed 「20% or below」 and 「21% - 40%」 of their current monthly income would be adequate. Nearly a quarter (24%) opted for 「41% - 50%」 whereas 11% each expected 「51% - 70%」 and 「above 70%」. Excluding those who had no clue, taking an average, 820 respondents thought they would need 46% of their current monthly personal income to maintain their sufficiency after retirement (standard error: 0.88%, Table 5). See Figure 2. 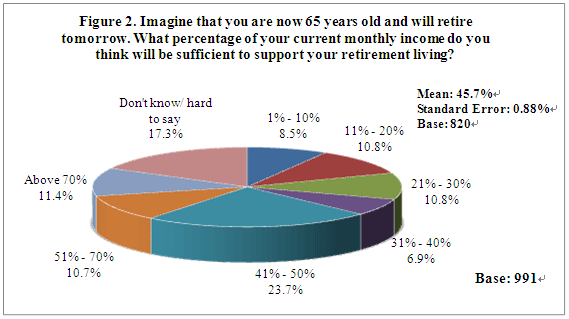 3.3 At present, MPF mandatory contributions are set at 10% of the members』 monthly salary, that is 5% from the employer and 5% from the employee. Results showed that only 17% of respondents said such amount was sufficient while 77% held an opposite view. A small number failed to give a definite answer (6%; Table 6). See Figure 3.  3.4 Among those respondents who said 10% contributions were insufficient, they thought 22% of their monthly personal income on average would be good enough (standard error: 0.38%). Specifically, 16% believed the contributions should take up 「11% -15%」 of one』s monthly income. The majority of 41% thought 「16% - 20%」 while one-tenth said 「20% - 30%」 (10%). A small proportion considered it adequate only if the contributions were 「above 30%」 (5%). Meanwhile, 28% of the sub-sample failed to provide a definite answer to this question (Table 7). Also see Figure 4. 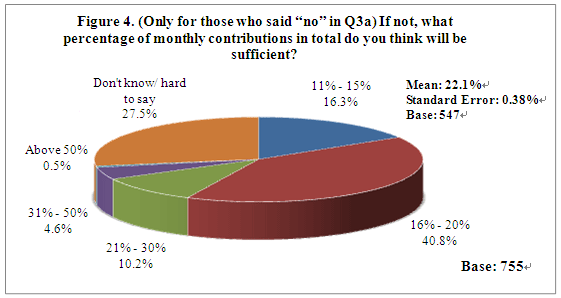 3.5 At the same time, the salary cap for MPF contributions is now set at $20,000 per month. As for whether this salary cap was appropriately set, results showed that opinions split. Those who responded positively (47%) and negatively (44%) both took up around 45% of the sample while nearly one-tenth said 「don』t know/hard to say」 (9%, Table 8). See Figure 5.  3.6 When asked what should be the salary cap per month, 6% of those respondents who thought the current level 「not appropriate」 believed that it should be increased to 「$20,001 - $25,000」 whilst 20% suggested 「$25,001 - $30,000」. The proportions for 「$30,001 - $35,000」, 「$35,001 - $40,000」 and 「more than $40,000」 were 11%, 11% and 18% respectively. On the other hand, more than a quarter thought 「no cap should be in place」 (27%). Excluding the option 「no salary cap」 and other invalid answers, 289 respondents thought the salary cap should be set at $32,933 per month on average (standard error: $353; Table 9). See Figure 6. 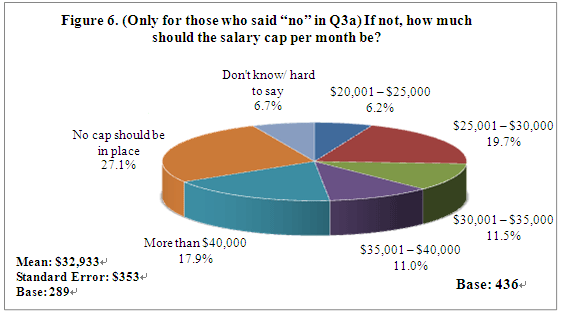 3.7 Apart from the MPF scheme, 38% of the respondents had not taken any other actions to plan ahead for their retirement. The most common reason was 「had no extra money」 as cited by 26% of the sub-sample. Another 6% wanted to but 「did not know how」 while 2% each had done nothing because they thought 「MPF was sufficient」, 「their family would support them」 and 「had enough money for their retirement」. On the contrary, 59% of the overall sample had made other financial plans for their retirement, of which more than 40% each claimed to 「have saved more」 (43%) and 「buy insurance」 (42%). A respective of 35% and 34% had invested in 「mutual funds」 and 「stock market」 (excluding derivatives) while one-tenth chose to invest in 「properties」 (10%, Table 10 and 11). See Figures 7 and 8. 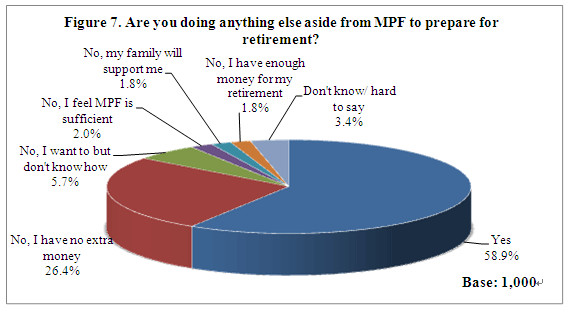  3.8 On top of the mandatory contribution, 87% of the MPF contributors did not make any voluntary contributions while only 11% did. Specifically, a respective of 3% and 4% contributed 「less than $500」 and 「$501 - $1,000」 a month while 2% each topped up their contributions by 「$1,001 - $2,000」 and 「above $2,000」. Taking an average of these 110 voluntary contributors, each of them made $1,825 more per month (standard error: $246) and the median was $1,000 (Table 12). See Figure 9.  3.9 How about respondents』 plan in 5 years time? Results showed that the majority still had no plan to make top-up contribution, but the figure dropped to 73% (from 87%). On the other hand, those who said they would increase to 15% (from 11%). Specifically, 2% planned to save 「less than $500」 for their MPF voluntary contribution a month five years later, 6% said 「$501 - $1,000」 while 3% each opted for 「$1,001 - $2,000」 and 「above $2,000」. Yet, 12% failed to provide a definite answer. Overall speaking, 145 respondents who planned to make voluntary contributions 5 years later would save $1,941 more per month (standard error: $204), and the median was $1,000 (Table 13). See Figure 10.  3.10 The survey continued by asking respondents what motivated them to make more MPF contributions to their MPF accounts. Results showed that 43% would do so when 「they made more money」, closely followed by the situation when 「their employer made top-up MPF contribution for them」 (41%). In the meantime, 31% regarded 「extra tax allowance」 a good motivator. Those who said 「when I paid off my mortgage」, 「improvement in investment market」 and 「when I stepped into another life stage」 accounted for 19%, 17% and 16% correspondingly. Yet, as high as 26% said 「nothing」 would motivate them to make top-up contribution (Table 14). See Figure 11.  3.11 Among the 1,001 respondents, less than 30% had heard of 「MPF member choice」 (28%) at the time of interview while the majority of 72% had not (Table 15). See Figure 12.  3.12 When asked which part of the contributions could be transferred to another service provider under the 「MPF Member Choice」 scheme, results showed that 71% of the employees in this sample had no idea at all. Meanwhile, 17% said 「employee』s mandatory contribution」 while a small proportion mistakenly thought 「employee』s voluntary contribution」 (6%) and 「employer』s mandatory contribution (1%). Those who said 「all」 accounted for 7% (Table 16). See Figure 13.  3.13 By the time when respondents were allowed to withdraw their MPF savings, 26% said they would keep the saving in 「cash」, 14% would put them into 「investment」. Those who would opt for 「both」 took up the largest proportion of 52% (Table 20). Also see Figure 17.  3.14 For respondents who would put all or part of their savings into investment, 44% said they already had an investment plan whereas the remaining 56% said 「no」 (Table 21). Also see Figure 18.  3.15 Among respondents who had plans for their investment, 53% would 「withdraw them in one go and choose investment vehicles」, 26% would 「transfer part of their savings to products like insurance and annuity」 and 15% would 「leave the investment fund units in their MPF accounts」 (Table 22). See Figure 19.  3.16 Findings of this survey also revealed that 29% of the respondents last reviewed their MPF investment portfolio 「within 6 months」 and 13% said 「7-12 months ago」. Meanwhile, 29% did so 「more than 1 year ago」 whereas 24% had 「never」 reviewed their portfolio so far (Table 23). See Figure 20.  3.17 The survey ended by asking all respondents how often they planned to review their portfolio in future. Results showed that only a small proportion said 「monthly」 (3%) and 「quarterly」 (6%). Those who would review their portfolio 「half-yearly」 and 「every 7-12 months」 accounted for 21% and 20% respectively while 8% planned to do it 「over a year」. Nevertheless, the majority of 31% had no plan to review it at all while nearly one-tenth said only 「when they had time」 (9%, Table 24). Also See Figure 21.  |


