Research FindingsBack
|
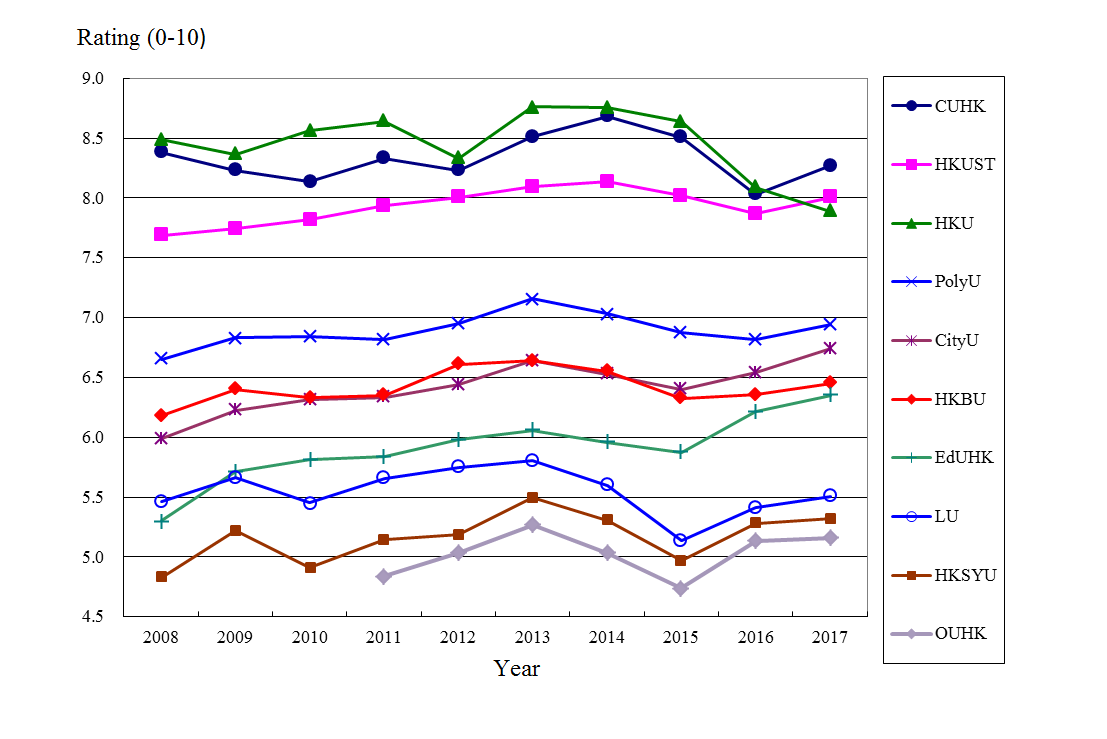
The questionnaire comprised 7 key questions. First of all, all respondents were asked to evaluate each of the 10 universities based on their perception of its overall performance using a scale of 0-10, with 0 representing the worst, 10 representing the best and 5 being half-half. Respondents were suggested to take into account the university’s local and international reputation, facilities, campus environment, qualification of its teaching staff, academic research performance, conduct and quality of its students, its learning atmosphere, as well as the diversification and degree of recognition for its courses. Survey results indicated that, in terms of principals’ perception, CUHK received the highest mean score of 8.27, rated by 70 principals, HKUST came second with an average score of 8.00 whereas HKU ranked third with a mean score of 7.89. For other universities’ performance scores, please refer to Tables 2 and 3 below. |
Table 2. Overall Performance of Each University |
[Q1] Please use a scale of 0-10 to evaluate the overall performance of each university after taking into consideration its local and international reputation, facilities and campus environment, qualification of its teaching staff, academic research performance, conduct and quality of students as well as its learning atmosphere, diversification and level of recognition of its courses, with 0 representing the worst, 10 representing the best and 5 being half-half. How would you rate the following universities? |
||||
|
Average |
Standard error |
No of raters |
Recognition |
|
|
CUHK |
8.27 |
0.18 |
70 |
98.6% |
|
HKUST |
8.00 |
0.16 |
71 |
100.0% |
|
HKU |
7.89 |
0.22 |
71 |
100.0% |
|
PolyU |
6.94 |
0.13 |
70 |
98.6% |
|
CityU |
6.74 |
0.12 |
70 |
98.6% |
|
HKBU |
6.45 |
0.12 |
69 |
97.2% |
|
EdUHK |
6.35 |
0.14 |
69 |
97.2% |
|
LU |
5.51 |
0.18 |
69 |
97.2% |
|
HKSYU |
5.32 |
0.18 |
68 |
95.8% |
|
OUHK |
5.16 |
0.18 |
69 |
97.2% |
[1] On 27 May 2016, HKIEd was formally renamed The Education University of Hong Kong (EdUHK).
Table 3. Time-series Figures for Overall Performance of Each Institution 2008-2017 |
|
2008 Survey |
2009 Survey |
2010 Survey |
2011 Survey |
2012 Survey |
|||||||||||||||||||
|
Average |
Standard error |
Average |
Standard error |
Average |
Standard error |
Average |
Standard error |
Average |
Standard error |
||||||||||||||
|
1. CUHK |
8.38 |
0.13 |
8.23 |
0.13 |
8.14 |
0.11 |
8.33 |
0.15 |
8.23 |
0.15 |
|||||||||||||
|
2. HKUST |
7.69 |
0.11 |
7.74 |
0.11 |
7.82 |
0.11 |
7.94 |
0.15 |
8.00 |
0.15 |
|||||||||||||
|
3. HKU |
8.49 |
0.14 |
8.37 |
0.14 |
8.56 |
0.12 |
8.64 |
0.15 |
8.33 |
0.18 |
|||||||||||||
|
4. PolyU |
6.65 |
0.09 |
6.83 |
0.09 |
6.84 |
0.10 |
6.81 |
0.10 |
6.95 |
0.11 |
|||||||||||||
|
5. CityU |
5.99 |
0.09 |
6.22 |
0.09 |
6.32 |
0.09 |
6.33 |
0.11 |
6.44 |
0.11 |
|||||||||||||
|
6. HKBU |
6.18 |
0.10 |
6.40 |
0.09 |
6.33 |
0.10 |
6.35 |
0.10 |
6.61 |
0.09 |
|||||||||||||
|
7. EdUHK[1] |
5.30 |
0.13 |
5.72 |
0.13 |
5.82 |
0.13 |
5.84 |
0.13 |
5.98 |
0.13 |
|||||||||||||
|
8. LU |
5.46 |
0.12 |
5.66 |
0.12 |
5.45 |
0.12 |
5.66 |
0.13 |
5.75 |
0.12 |
|||||||||||||
|
9. HKSYU |
4.83 |
0.14 |
5.22 |
0.15 |
4.91 |
0.16 |
5.14 |
0.16 |
5.19 |
0.15 |
|||||||||||||
|
10. OUHK[2] |
-- |
-- |
-- |
-- |
-- |
-- |
4.84 |
0.17 |
5.03 |
0.19 |
|||||||||||||
|
2013 Survey |
2014 Survey |
2015 Survey |
2016 Survey |
2017 Survey |
||||||||||||||||||
|
Average |
Standard error |
Average |
Standard error |
Average |
Standard error |
Average |
Standard error |
Average |
Standard error |
No. of raters |
Recognition |
|||||||||||
|
1. CUHK |
8.51 |
0.13 |
8.68 |
0.12 |
8.51 |
0.11 |
8.03 |
0.17 |
8.27 |
0.18 |
70 |
98.6% |
||||||||||
|
2. HKUST |
8.10 |
0.11 |
8.14 |
0.13 |
8.02 |
0.10 |
7.87 |
0.17 |
8.00 |
0.16 |
71 |
100.0% |
||||||||||
|
3. HKU |
8.76 |
0.14 |
8.76 |
0.16 |
8.64 |
0.12 |
8.09 |
0.19 |
7.89 |
0.22 |
71 |
100.0% |
||||||||||
|
4. PolyU |
7.16 |
0.10 |
7.03 |
0.10 |
6.88 |
0.11 |
6.82 |
0.13 |
6.94 |
0.13 |
70 |
98.6% |
||||||||||
|
5. CityU |
6.64 |
0.10 |
6.53 |
0.11 |
6.40 |
0.11 |
6.55 |
0.12 |
6.74 |
0.12 |
70 |
98.6% |
||||||||||
|
6. HKBU |
6.64 |
0.09 |
6.55 |
0.11 |
6.32 |
0.11 |
6.36 |
0.14 |
6.45 |
0.12 |
69 |
97.2% |
||||||||||
|
7. EdUHK[1] |
6.06 |
0.11 |
5.96 |
0.13 |
5.87 |
0.13 |
6.21 |
0.15 |
6.35 |
0.14 |
69 |
97.2% |
||||||||||
|
8. LU |
5.80 |
0.12 |
5.60 |
0.13 |
5.14 |
0.14 |
5.42 |
0.19 |
5.51 |
0.18 |
69 |
97.2% |
||||||||||
|
9. HKSYU |
5.49 |
0.14 |
5.31 |
0.16 |
4.97 |
0.14 |
5.28 |
0.18 |
5.32 |
0.18 |
68 |
95.8% |
||||||||||
|
10. OUHK[2] |
5.27 |
0.14 |
5.04 |
0.16 |
4.74 |
0.14 |
5.14 |
0.19 |
5.16 |
0.18 |
69 |
97.2% |
||||||||||
[1] HKIEd was formally renamed The Education University of Hong Kong (EdUHK) in 2016
[2] Newly added in 2011.
Chart 1 - Overall Performance Ratings of Universities, 2008-2017 |
|
|
With respect to the perceived overall performance of the Vice-Chancellor/ President/Principal of each university, taking into consideration one’s local and international reputation, approachability, leadership, vision, social credibility and public relations, Professor Joseph J.Y. Sung of CUHK topped the list with an average score of 8.59 rated by 71 respondents. Professor Tony F. Chan of HKUST and Professor Peter MATHIESON of HKU came second and third, with mean scores of 7.57 and 7.02, each as rated by 63 and 66 respondents respectively (Table 4). |
Table 4. Overall Performance of Each Vice-Chancellor / President / Principal |
[Q2] Please use a scale of 0-10 to evaluate the overall performance of Vice-Chancellor / President / Principal of each university while taking his local and international reputation, approachability to the public, leadership, vision, social credibility and public relations into consideration, with 0 representing the worst, 10 representing the best and 5 being half-half. How would you rate the following Vice-Chancellors / Presidents / Principal? |
||||
|
Average |
Standard error |
No of raters |
Recognition |
|
|
CUHK – Prof. Joseph J.Y. SUNG |
8.59 |
0.23 |
71 |
100.0% |
|
HKUST – Prof. Tony F. CHAN |
7.57 |
0.17 |
63 |
88.7% |
|
HKU – Prof. Peter MATHIESON |
7.02 |
0.21 |
66 |
93.0% |
|
EdUHK – Prof. Stephen Y.L. CHEUNG |
6.99 |
0.15 |
67 |
94.4% |
|
CityU – Prof. Way KUO |
6.89 |
0.15 |
62 |
87.3% |
|
PolyU – Prof. Timothy W. TONG |
6.74 |
0.20 |
58 |
81.7% |
|
HKBU – Prof. Roland T. CHIN |
6.48 |
0.18 |
60 |
84.5% |
|
HKSYU – Dr. Henry H.L. HU |
6.36 |
0.23 |
55 |
77.5% |
|
OUHK – Prof. Yuk-shan WONG |
6.28 |
0.17 |
57 |
80.3% |
|
LU – Prof. Leonard K. CHENG |
5.98 |
0.22 |
59 |
83.1% |
The next question asked the respondents’ opinion on the qualities which most Hong Kong university students lack of. Results showed that “work attitude” was most commonly cited, as chosen by 62% of respondents. The next tier included “commitment to society”, “social / interpersonal skills”, “conduct, honesty”, “global prospect / foresight” and “emotion stability”, accounting for 59%, 52%, 51%, 42% and 37% of respondents correspondingly (Tables 5 and 6). |
Table 5. Perceived Deficiencies among the University Students in Hong Kong |
[Q3] What do you think are the qualities which most Hong Kong university students lack of? [multiple answers allowed] |
|||
|
Frequency |
% of total responses (Base = 340 responses from 71 respondents) |
% of total sample (Base = 71) |
|
|
Work attitude |
44 |
12.9% |
62.0% |
|
Commitment to society |
42 |
12.4% |
59.2% |
|
Social / interpersonal skills |
37 |
10.9% |
52.1% |
|
Conduct, honesty |
36 |
10.6% |
50.7% |
|
Global prospect / foresight |
30 |
8.8% |
42.3% |
|
Emotion stability |
26 |
7.6% |
36.6% |
|
Critical thinking and problem-solving ability |
22 |
6.5% |
31.0% |
|
Communication skills |
17 |
5.0% |
23.9% |
|
Job opportunity |
17 |
5.0% |
23.9% |
|
Proficiency in Chinese, English and Putonghua |
16 |
4.7% |
22.5% |
|
Social / work experience |
12 |
3.5% |
16.9% |
|
Creativity |
12 |
3.5% |
16.9% |
|
Academic and professional knowledge |
9 |
2.6% |
12.7% |
|
Financial management |
8 |
2.4% |
11.3% |
|
Self-confidence |
7 |
2.1% |
9.9% |
|
Others (see Table 6) |
5 |
1.5% |
7.0% |
|
Not lack of anything |
-- |
-- |
-- |
|
Don’t know |
-- |
-- |
-- |
|
Total |
340 |
100.0% |
|
|
Base |
71 |
||
|
Missing case(s) |
0 |
||
Table 6. Q3 (Other answers in exact wordings) |
|
|
Question 4 asked the principals the impact of the current secondary school curriculum on enhancing students’ civic awareness. Results revealed that 29% of the principals thought the impact was useful, 37% thought it “half-half” and 34% thought the impact was useless (Tables 7 and 8). |
Table 7. The Impact of the Current Secondary School Curriculum on Enhancing Students’ Civic Awareness |
[Q4] How useful do you think is the impact of the current secondary school curriculum on enhancing students’ civic awareness? [one answer allowed] |
|||||
|
Frequency |
% of valid respondents (Base = 70) |
||||
|
Very useful |
}Useful |
2 |
} 20 |
2.9% |
} 28.6% |
|
Quite useful |
18 |
25.7% |
|||
|
Half-half |
26 |
37.1% |
|||
|
Quite useless |
}Useless |
20 |
} 24 |
28.6% |
} 34.3% |
|
Very useless |
4 |
5.7% |
|||
|
Don’t know |
-- |
-- |
|||
|
Total |
70 |
100.0% |
|||
|
Base |
71 |
||||
|
Missing case(s) |
1 |
||||
|
|
Table 8. Time-series Figures for the Impact of the Current Secondary School Curriculum on Enhancing Students’ Civic Awareness 2014-2017 |
|
|
2014 |
2015 |
2016 |
2017 |
|
Useful |
36.8% |
29.1% |
30.4% |
28.6% |
|
Half-half |
42.1% |
37.2% |
39.2% |
37.1% |
|
Useless |
18.9% |
31.4% |
29.1% |
34.3% |
|
Don’t know |
2.1% |
2.3% |
1.3% |
-- |
|
Total |
95 |
86 |
79 |
70 |
Question 5 is repeated from 2012 and asked school principals what they expected in the education policies from the new term of SAR Government and multiple answers were allowed. Results revealed that 89% of the principals expected to “increase funding on education expenses”, 52% expected to “stop/reduce cutting schools”, while 49% expected to “stop/reduce the interference on school management” (Tables 9 to 11)
Table 9. Expectation on the Education Policies from the New Term of SAR Government |
[Q5] What do you expect in the education policies from the new term of SAR Government? [multiple answers allowed] |
|||||
|
Frequency |
% of total responses (Base = 181 responses from 71 respondents) |
% of total sample (Base = 71) |
|||
|
Increase funding on education expenses |
63 |
34.8% |
88.7% |
||
|
Stop/reduce cutting schools |
37 |
20.4% |
52.1% |
||
|
Stop/reduce the interference on school management |
35 |
19.3% |
49.3% |
||
|
Strengthen administrative support |
32 |
17.7% |
45.1% |
||
|
Improve school-based management |
9 |
5.0% |
12.7% |
||
|
Others (see Table 11) |
4 |
2.2% |
5.6% |
||
|
No expectations |
1 |
0.6% |
1.4% |
||
|
Total |
181 |
100.0% |
|||
|
Base |
71 |
||||
|
Missing case(s) |
0 |
||||
|
The last question was in open-end format that served to probe for respondents’ in-depth opinions regarding the subject matter and/or the survey. Please refer to Table 14 below for the submissions received.
No. of hits since Jun 3, 2000: 93,154,811
No. of hits since Jan 1, 2018: 7,708,430
Everything carried in this website does not represent the stand of the University of Hong Kong. Dr Robert Ting-Yiu Chung, Director of Public Opinion Programme, is responsible for everything posted herewith, except for column articles and messages posted at the opinion platforms. Any responsibility, legal and otherwise, arising from any such item shall vest entirely with its author. The intellectual property of all information contained in this website, including questionnaire design and research reports, originally belongs to HKU POP unless specified otherwise. HKU POP opens their copyright to the world via this website, but would request all users to acknowledge their source properly.
HKU POP all rights reserved.
Last update : 26/6/2019
| ||||||||||||||||||||||||||||||||||||||||||||||||||||||||||||||||||||||||||||||||||||||||||||||||||||||||||||||||||||||||||||||||||||||||||||||||||||||||||||||||||||||||||||||||||||||||||||||||||||||||||||||||||||||||||||||||||||||||||||||||