HKU POP releases Legislative Council election survey for the fifth timeBack
| Press Release on September 10, 2012 | |||||||||
|
| Abstract | Latest Figures | Commentary | Future Release (Tentative) | | |||||||||
Abstract On the day before the election, The Public Opinion Programme (POP) at the University of Hong Kong has already announced all rolling survey data up to September 5, the remaining two days of data were announced by the sponsoring media. Today after the election, POP will release all rolling survey data so they are accessible for the public to judge the accuracy and reference value. POP interviewed 16,253 registered voters in between August 1 to September 7, 2012 by means of random telephone surveys conducted by real interviewers. This press release and additional charts on POP website have accounted in detail the voters’ propensity to vote, stray vote percentages, supporting rate, sampling error as well as the prediction of the winning chance of each candidate. Readers may refer to POP Site as well. Points to note: [1] The address of the "HKU POP SITE" is http://hkupop.pori.hk, journalists can check out the details of the survey there.
| |||||||||
Latest Figures Whenever there are large-scale elections, POP would conduct regular surveys to track opinion changes. On election day, POP would also conduct exit polls to study voter behaviour and motivation. Sponsored surveys will be used exclusively by sponsors first, and then uploaded online for public consumption after the election. Unsponsored surveys will be released to the general public immediately after they are conducted. On August 14, 23, September 5 and 7, POP made the first four public releases respectively, today is the fifth one, with the following contact information. All figures have been weighted according to the distribution of age, gender and geographic constituency of registered voters in the 2012 electoral roll provided by the Registration and Electoral Office:
Three findings of this rolling survey are summarized below, together with parallel figures obtained in the last Legislative Council elections of 2004 and 2008 for the first two findings:
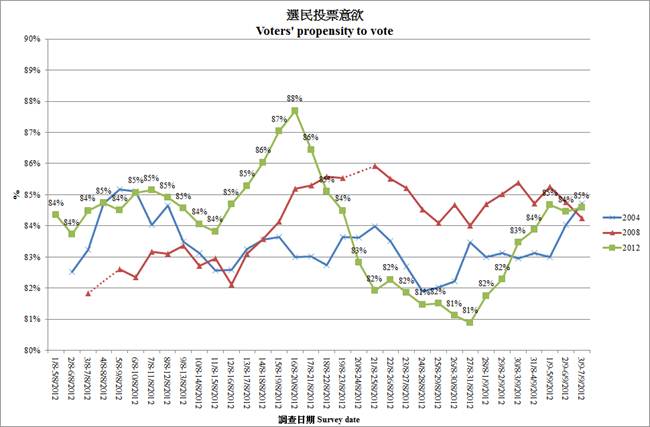
1. Propensity to vote (Territory-wide)
Survey revealed that the propensity to vote in general falls within the range of 81% to 88%. It started with 84% in early August, then rose to 88% in mid-August, followed by dropping to as low as 81% in late-August and finally rebounded to 85% recently. If to compare with 2004 and 2008, the fluctuations seems to be more significant this year.
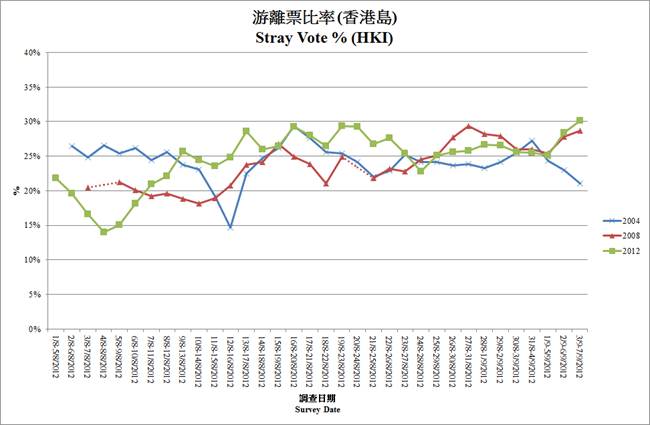
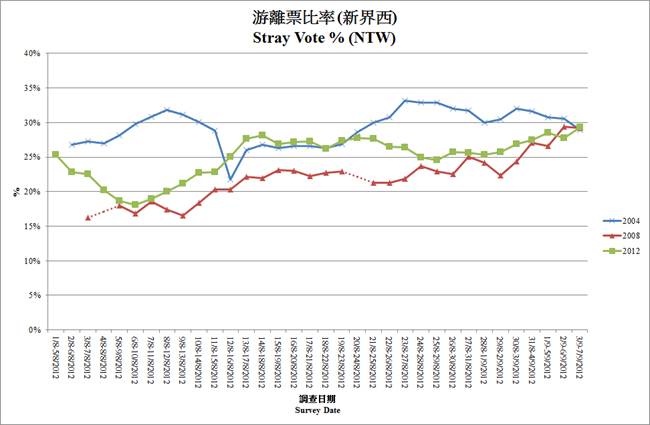
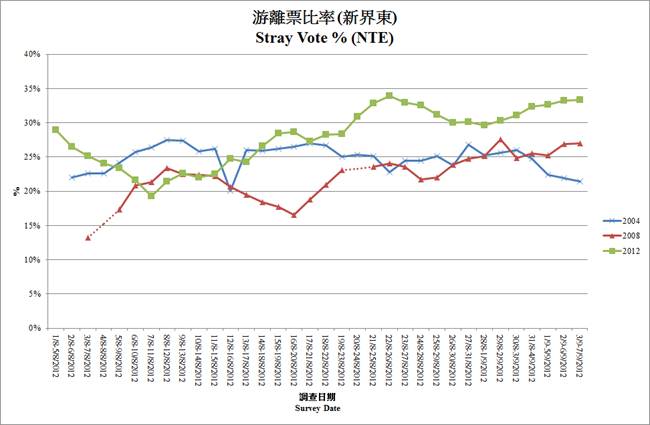
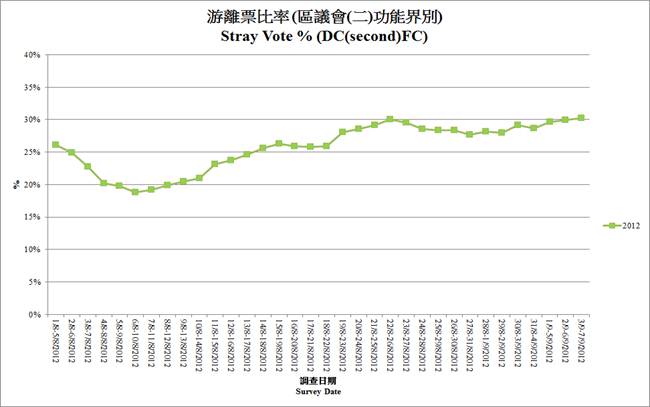
2. Percentage of stray votes
Since many voters still have not decided how to cast their vote, while stray voters would always have significant influence on the election result, POP therefore further looked into the distribution of these votes in each constituency. In this analysis, “stray votes” is defined as likely voters who have not decided how they would vote. Hong Kong Island GC
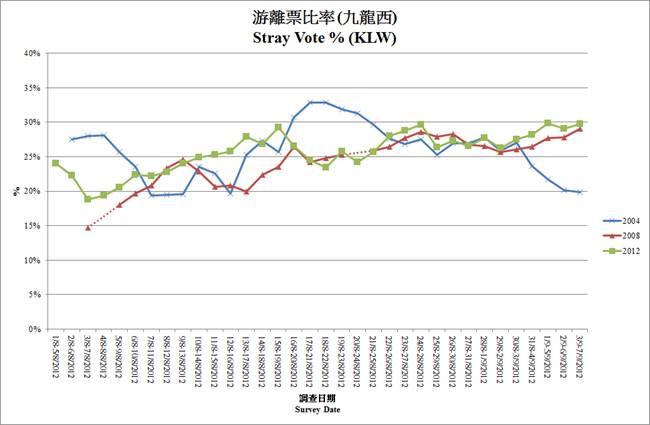
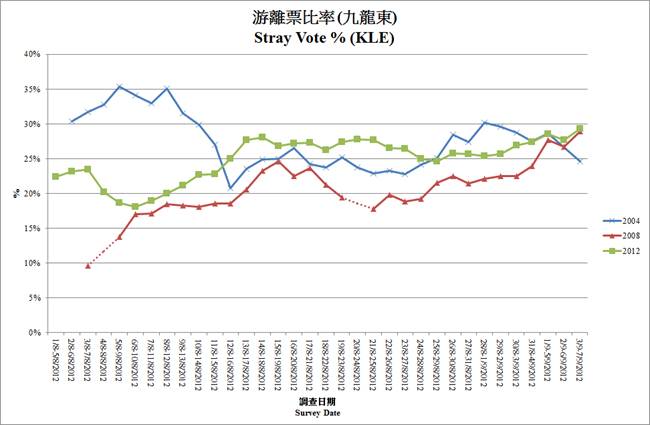
Kowloon West GC Kowloon East GC
New Territories West GC New Territories East GC
District Council (Second) Functional Constituency Similar to what happened in 2004 and 2008, the percentage of stray votes in this year falls within 20% to 30% up to now in various constituencies. Among them, the percentage was as high as 35% for once in New Territories East GC.
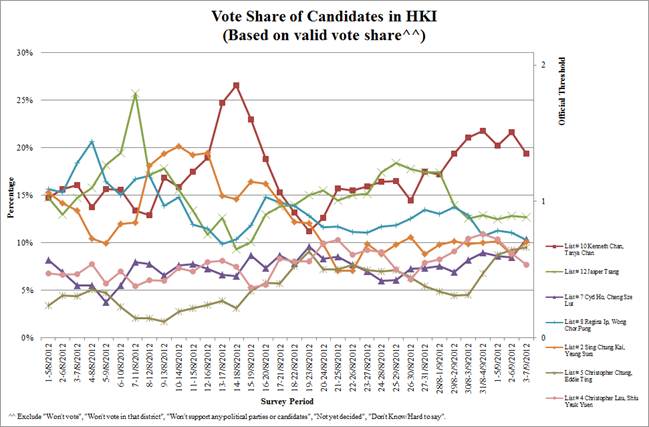
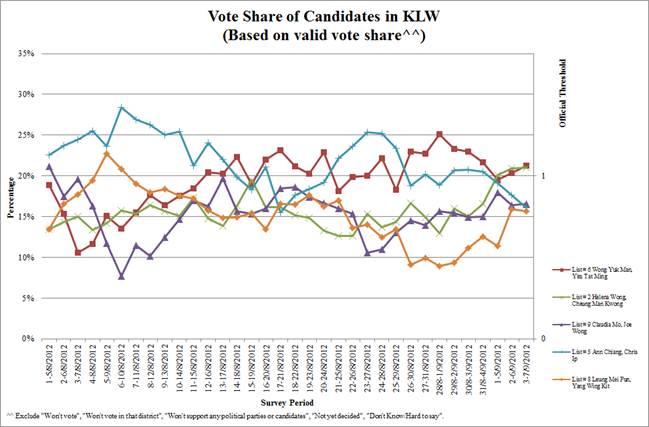
3.Candidate strength in each constituency
Hong Kong Island GC
Kowloon West GC
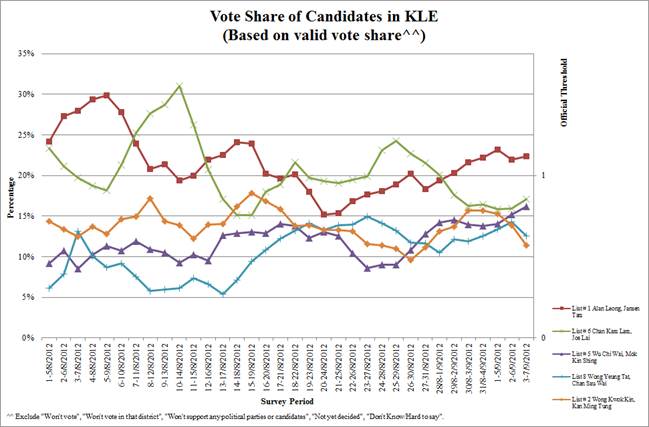
Kowloon East GC
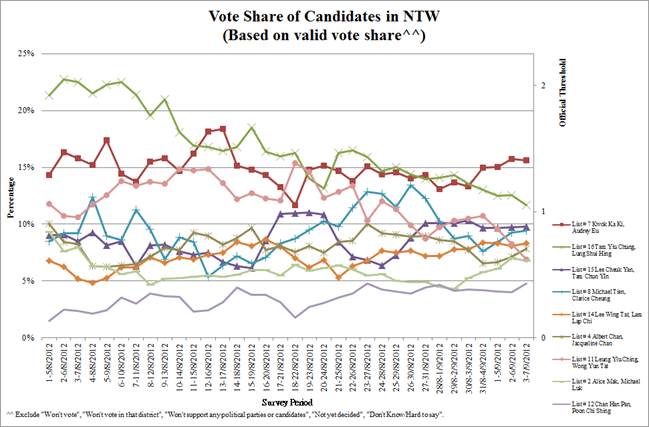
New Territories West GC
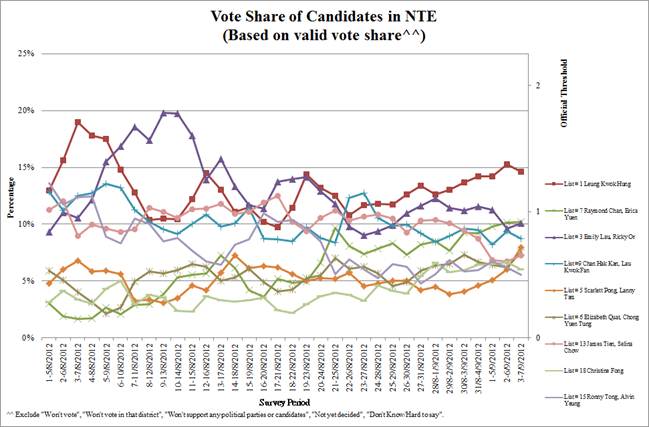
New Territories East GC
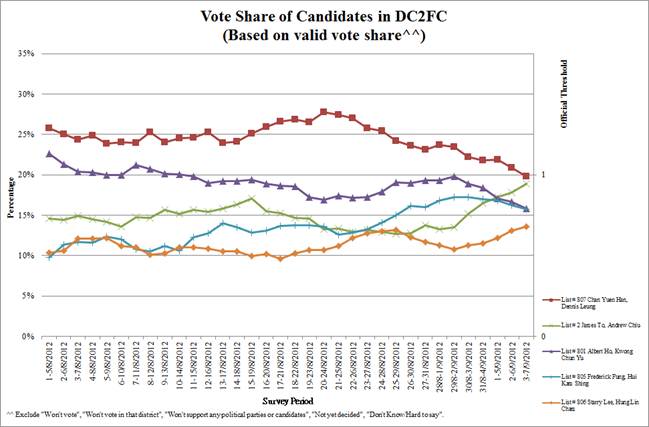
District Council (Second) Functional Constituency
The number of seats of this year’s Legislative Council election has increased and the highest balance method of proportional representation turned out to be on the basis of “multiple-seat, single vote” in disguise, encouraging political groups to split their lists in election, allowing multiple lists to be elected with lower threshold of votes using electioneering. Since political groups are splitting their lists, making the votes scattered, the supporting rates of the candidate lists are low across the board, hence the concept of error has become relatively important. Analysis shows that the situation of the 5 GCs is pretty competitive. According to the final 5-day rolling survey, the situation of the 5 GCs and the District Council (second) functional constituency is as follows: [13]
[13] Please refer to the tables online for details.
|
|||||||||
Commentary Director of POP Robert Chung explains: “On the day before the election, POP has already announced all rolling survey data up to September 5 before the election day, the remaining two days of data were announced by the sponsoring media. POP will release all rolling survey data today after the election, so they are accessible for the public to judge its accuracy and reference value. Please stay tuned for the data of exit poll on the election day which will be announced in due course.” | |||||||||
Future Release (Tentative)
| |||||||||
|
| Abstract | Latest Figures | Commentary | Future Release (Tentative) | |