


HKU POP releases people’s appraisal of news media and the PSIBack
Press Release on February 4 , 2019
| Detailed Findings (People's Appraisal of the Local News Media) |
| Detailed Findings (Public Sentiment Index Feature Page) |
Contact Information
|
Date of survey |
: |
21-24/1/2019 |
|
Survey method |
: |
Random telephone survey conducted by real interviewers |
|
Target population |
: |
Cantonese-speaking Hong Kong residents aged 18 or above |
|
Sample size[1] |
: |
1,000 |
|
Effective response rate[2] |
: |
59.0% |
|
Sampling error[3] |
: |
Sampling error of percentages not more than +/-4%, that of net values not more than +/-6% and that of ratings not more than +/-0.15 at 95% confidence level |
|
Weighting method[4] |
: |
Rim-weighted according to figures provided by the Census and Statistics Department. The gender-age distribution of the Hong Kong population came from “Mid-year population for 2017”, while the educational attainment (highest level attended) distribution and economic activity status distribution came from “Women and Men in Hong Kong - Key Statistics (2018 Edition)”. |
[1] Starting from April 2018, POP revised the landline and mobile sample ratio to 2 to 1. The figures released today by POP have already incorporated landline and mobile samples.
[2] Before September 2017, “overall response rate” was used to report surveys’ contact information. Starting from September 2017, “effective response rate” was used. In July 2018, POP further revised the calculation of effective response rate. Thus, the response rates before and after the change cannot be directly compared.
[3] All error figures in this release are calculated at 95% confidence level. “95% confidence level” means that if we were to repeat a certain survey 100 times with different random samples, we would expect 95 times having the population parameter within the respective error margins calculated. Because of sampling errors, when quoting percentages, journalists should refrain from reporting decimal places, whereas one decimal place can be used when quoting rating figures.
[4] In the past, the mobile sample would be rim-weighted according to the basic Public Sentiment Index (PSI) figures collected in the landline sample. In July 2018, POP further refined the weighting method. The landline sample and the mobile sample would no longer be processed separately. The mobile sample would also no longer be adjusted using the basic PSI figures collected in the landline sample. The overall effect is that the importance of the mobile sample would be increased.
People’s Appraisal of News Media
Latest Figures
Latest results of the news media survey are tabulated as follows:
|
Date of survey |
10-12/4/17 |
3-4/10/17 |
2-4/4/18 |
20-22/8/18 |
21-24/1/19 |
Latest change |
|
Sample size[5] |
528-753 |
498-541 |
549-706 |
547-570 |
541-564 |
-- |
|
Response rate |
72.3% |
59.5% |
57.9% |
53.0% |
59.0% |
-- |
|
Latest findings |
Finding |
Finding |
Finding |
Finding |
Finding & error |
-- |
|
People’s main source of news: Internet |
59% |
60% |
67%[7] |
63% |
69+/-4% |
+6%[7] |
|
People’s main source of news: Television |
75% |
79% |
74%[7] |
70% |
65+/-4% |
-5% |
|
People’s main source of news: Newspaper |
42%[7] |
54%[7] |
48%[7] |
47% |
52+/-4% |
+5% |
|
People’s main source of news: Radio |
20%[7] |
32%[7] |
29% |
30% |
30+/-4% |
+1% |
|
People’s main source of news: Friends |
11% |
17%[7] |
19% |
18% |
18+/-3% |
-- |
|
Satisfaction rate of news media[6] |
47% |
48% |
50% |
49% |
38+/-4% |
-11%[7] |
|
Dissatisfaction rate of news media[6] |
19% |
18% |
20% |
17% |
20+/-3% |
+3% |
|
Net satisfaction rate |
28% |
31% |
30% |
32% |
18+/-6% |
-14%[7] |
|
Mean value[6] |
3.3 |
3.3 |
3.3 |
3.3 |
3.2+/-0.1 |
-0.2[7] |
|
Credibility rating of news media |
5.69 |
5.77 |
5.67 |
5.89 |
5.77+/-0.15 |
-0.12 |
[5] This question only uses sub-samples of the surveys concerned.
[6] Collapsed from a 5-point scale. The mean value is calculated by quantifying all individual responses into 1, 2, 3, 4, 5 marks according to their degree of positive level, where 1 is the lowest and 5 the highest, and then calculate the sample mean.
[7] Such changes have gone beyond the sampling errors at 95% confidence level, meaning that they are statistically significant prima facie. However, whether numerical differences are statistically significant is not the same as whether they are practically useful or meaningful, and different weighting methods could have been applied in different surveys.
Results of the latest survey showed that 69% and 65% of the respondents claimed their main sources of news were internet and television respectively. Overall speaking, the latest satisfaction rate of news media was 38%, net satisfaction at positive 18 percentage points, and the mean value is 3.2, meaning close to “half-half” in general. Besides, on a scale of 0-10, the latest credibility rating of the Hong Kong news media was 5.77 marks.
Public Sentiment Index
Background
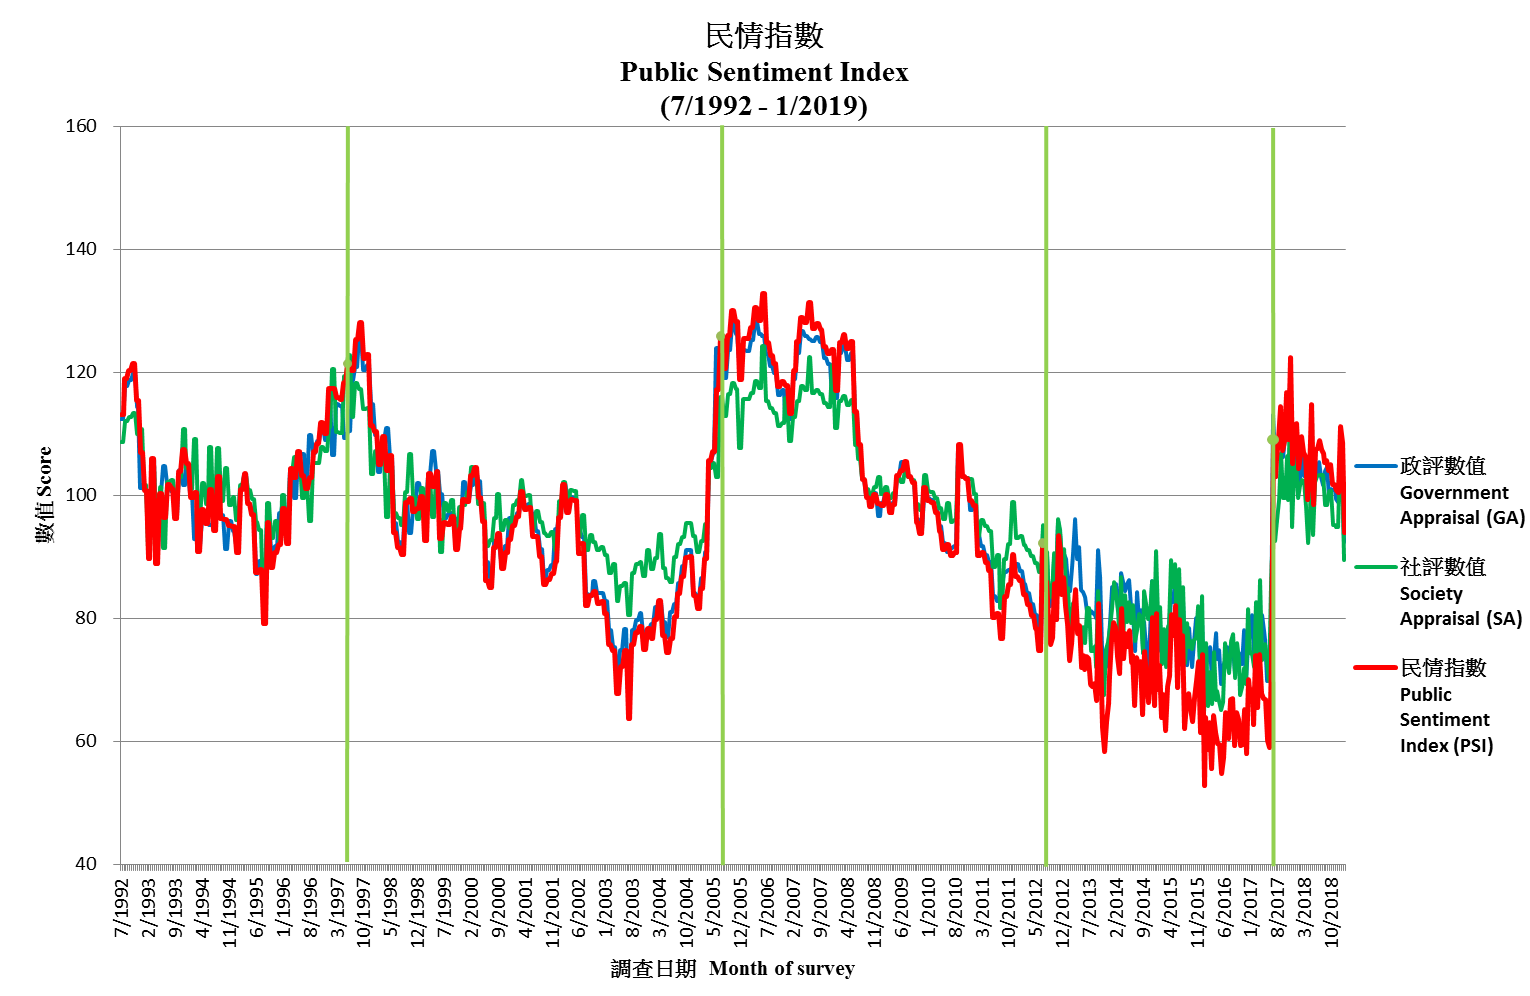
The Public Sentiment Index (PSI) compiled by POP aims at quantifying Hong Kong people’s sentiments, in order to explain and predict the likelihood of collective behaviour. PSI comprises 2 components: one being Government Appraisal (GA) Score and the other being Society Appraisal (SA) Score. GA refers to people’s appraisal of society’s governance while SA refers to people’s appraisal of the social environment. Both GA and SA scores are compiled from a respective of 4 and 6 opinion survey figures. All PSI, GA and SA scores range between 0 to 200, with 100 meaning normal, the grading reference of the scores are shown below. For methodological detailed please refer to the HKU POP Site at http://hkupop.pori.hk.
At the end of June 2012, before the 15th anniversary of the handover of Hong Kong, POP officially released a PSI analysis with figures dating back to 1992, spanning over 20 years. Moreover, the frequency of the study was set at twice a month. Currently, the cut-off dates of all PSI analyses are set at the Sundays proceeding every 15th and last day of month. The first analysis of each month would be released through the POP Site at the Thursday following the cut-off date, while the second analysis would be released at the first Tuesday of the following month through the POP Site and press release.
Latest Figures of PSI
The PSI released by POP today shows that as of January 27, 2019, the latest Public Sentiment Index (PSI) is 93.9, down 14.6 from early January. As for the Government Appraisal (GA) and Society Appraisal (SA), the scores are 92.4 and 89.5, down by 9.9 and 16.3 respectively. The chart of PSI, GA and SA are shown below:
|
|
|||
|
Latest figure |
Public Sentiment Index
|
Government Appraisal
|
Society Appraisal
|
Recent values of PSI, GA, SA and 10 fundamental figures are tabulated as follows:
|
Release date |
15/11/18 |
4/12/18 |
13/12/18 |
2/1/19 |
17/1/19 |
4/2/19 |
Latest change |
|
Cut-off date |
11/11/18 |
25/11/18 |
9/12/18 |
30/12/18 |
13/1/19 |
27/1/19 |
-- |
|
Public Sentiment Index (PSI) |
101.8 |
100.7 |
100.5 |
111.3 |
108.5 |
93.9 |
-14.6 |
|
Government Appraisal (GA) |
100.8 |
99.3 |
99.0 |
107.2 |
102.3 |
92.4 |
-9.9 |
|
Rating of CE |
52.3 |
50.2 |
50.2 |
56.4 |
50.9 |
45.5 |
-5.4 |
|
Net approval rate of CE |
-5% |
-4% |
-7% |
10% |
-11% |
-20% |
-9% |
|
Mean value of people’s satisfaction with SARG [8] |
2.8[9] |
2.7 |
2.7[9] |
3.0 |
3.0[9] |
2.5 |
-0.5 |
|
Mean value of people’s trust in SARG[8] |
3.0[9] |
3.0 |
3.0[9] |
3.0[9] |
3.0[9] |
3.0 |
-- |
|
Society Appraisal (SA) |
95.2[9] |
94.8 |
94.8[9] |
105.8 |
105.8[9] |
89.5 |
-16.3 |
|
People’s satisfaction with political condition [8] |
2.2[9] |
2.2 |
2.2[9] |
2.4 |
2.4[9] |
2.2 |
-0.1 |
|
Weighting index of political condition |
0.31[9] |
0.31[9] |
0.31[9] |
0.30 |
0.30[9] |
0.30[9] |
-- |
|
People’s satisfaction with economic condition [8] |
2.8[9] |
2.9 |
2.9[9] |
3.0 |
3.0[9] |
2.8 |
-0.3 |
|
Weighting index of economic condition |
0.34[9] |
0.34[9] |
0.34[9] |
0.34 |
0.34[9] |
0.34[9] |
-- |
|
People’s satisfaction with livelihood condition [8] |
2.6[9] |
2.5 |
2.5[9] |
2.7 |
2.7[9] |
2.4 |
-0.3 |
|
Weighting index of livelihood condition |
0.35[9] |
0.35[9] |
0.35[9] |
0.35 |
0.35[9] |
0.35[9] |
-- |
[8] From October to December 2018, POP conducted tests on the wordings used in different rating scales. Figures in the table are the combined results. Please visit the POP Site for details.
[9] POP will adopt the latest published figures when there are no respective updates.
As for the meaning of the score values, please refer to the following:
|
Score value |
Percentile |
Score value |
Percentile |
|
140-200 |
Highest 1% |
0-60 |
Lowest 1% |
|
125 |
Highest 5% |
75 |
Lowest 5% |
|
120 |
Highest 10% |
80 |
Lowest 10% |
|
110 |
Highest 25% |
90 |
Lowest 25% |
|
100 being normal level, meaning half above half below |
|||
The latest PSI of 93.9 can be considered as among the worst 34% across the past 20 years or so, while the GA and SA scores of 92.4 and 89.5 can be considered as among the worst 31% and 24% respectively.
Commentary
Note: The following commentary was written by Research Manager of POP, Frank Lee.
Our latest survey shows that, among various types of news media, the internet has replaced television to become people’s main sources of news for the first time. The former is now at record high since the survey question was first asked in 2000, while the latter has dropped to a new low. In terms of performance satisfaction, overall speaking, people’s net satisfaction with the performance of the news media has plunged by 14 percentage points compared to five months ago to positive 18 percentage points, also a record low since the survey question was first asked in 1993. We should all take note of the latest changes in overall trends and people’s appraisals. Besides, on a scale of 0-10, the latest credibility rating of the Hong Kong news media stands at 5.77 marks.
As for the Public Sentiment Index (PSI), the latest PSI stands at 93.9, decreased significantly by 14.6 points compared to two weeks ago, to a record low since the new administration took office. This time both component scores of PSI have decreased. Specifically, the Government Appraisal (GA) Score that reflects people’s appraisal of society’s governance goes down by 9.9 points to 92.4, whereas the Society Appraisal (SA) Score that reflects people’s appraisal of the social environment also decreases by 16.3 points to 89.5. As for the reasons affecting the ups and downs of these figures, we leave it to our readers to form their own judgment using detailed records displayed in our “Opinion Daily”.
Future Release (Tentative)
Reference Materials on Survey on PSI Please refer to the HKU POP Site at http://hkupop.pori.hk.
|


