


HKU POP releases popularity figures of CE and the Government and the PSIBack
Press Release on January 2, 2019
| Detailed Findings (Rating of Chief Executive Carrie Lam) |
| Detailed Findings (People's Satisfaction with the HKSAR Government) |
| Detailed Findings (People's Satisfaction with Current Political, Economic and livelihood conditions) |
| Detailed Findings (Public Sentiment Index Feature Page) |
Popularity of CE and the Government
Contact Information
|
Date of survey |
: |
17-20/12/2018 |
|
Survey method |
: |
Random telephone survey conducted by real interviewers |
|
Target population |
: |
Cantonese-speaking Hong Kong residents aged 18 or above |
|
Sample size[1] |
: |
1,000 |
|
Effective response rate[2] |
: |
60.6% |
|
Sampling error[3] |
: |
Sampling error of percentages not more than +/-4%, that of net values not more than +/-8% and that of ratings not more than +/-1.7 at 95% confidence level |
|
Weighting method[4] |
: |
Rim-weighted according to figures provided by the Census and Statistics Department. The gender-age distribution of the Hong Kong population came from “Mid-year population for 2017”, while the educational attainment (highest level attended) distribution and economic activity status distribution came from “Women and Men in Hong Kong - Key Statistics (2018 Edition)”. |
[1] Starting from April 2018, POP revised the landline and mobile sample ratio to 2 to 1. The figures released today by POP have already incorporated landline and mobile samples.
[2] Before September 2017, “overall response rate” was used to report surveys’ contact information. Starting from September 2017, “effective response rate” was used. In July 2018, POP further revised the calculation of effective response rate. Thus, the response rates before and after the change cannot be directly compared.
[3] All error figures in this release are calculated at 95% confidence level. “95% confidence level” means that if we were to repeat a certain survey 100 times with different random samples, we would expect 95 times having the population parameter within the respective error margins calculated. Because of sampling errors, when quoting percentages, journalists should refrain from reporting decimal places, whereas one decimal place can be used when quoting rating figures.
[4] In the past, the mobile sample would be rim-weighted according to the basic Public Sentiment Index (PSI) figures collected in the landline sample. In July 2018, POP further refined the weighting method. The landline sample and the mobile sample would no longer be processed separately. The mobile sample would also no longer be adjusted using the basic PSI figures collected in the landline sample. The overall effect is that the importance of the mobile sample would be increased.
Latest Figures
To facilitate academic study and rational discussion, the Public Opinion Programme (POP) of The University of Hong Kong today released via the “HKU POP Site” (http://hkupop.pori.hk) the raw data and related respondents’ demographics of the latest rating survey of CE Carrie Lam, together with those of regular rating surveys of former CEs CH Tung, Donald Tsang and CY Leung released earlier, for public examination. Please follow normal academic standards when using or citing such data.
Since the figures released by POP today come from the last tracking survey on this topic conducted by POP in 2018, they are good for year-end stories. Moreover, a chronology of major events as reported by the local newspapers over the past many years can be found in the “Opinion Daily” at the “POP Site”. This may also be useful in running year-end reviews.
Recent popularity figures of CE Carrie Lam are summarized as follows:
|
Date of survey |
10/10/18 [5] |
22-24/10/18 |
1-6/11/18 |
15-19/11/18 |
3-6/12/18 |
17-20/12/18 |
Latest change |
|
Sample size |
584 |
1,006 |
1,002 |
1,000 |
1,005 |
1,000 |
-- |
|
Response rate |
65.9% |
63.4% |
58.9% |
67.9% |
54.6% |
60.6% |
-- |
|
Latest findings |
Finding |
Finding |
Finding |
Finding |
Finding |
Finding & error |
-- |
|
Rating of CE Carrie Lam |
47.6[6] |
51.7[6] |
52.3 |
50.2 |
50.2 |
56.4+/-1.7 |
+6.2[6] |
|
Vote of confidence in CE Carrie Lam |
37%[6] |
41% |
40% |
40% |
39% |
49+/-3% |
+10%[6] |
|
Vote of no confidence in CE Carrie Lam |
48%[6] |
42%[6] |
45% |
44% |
47% |
39+/-3% |
-8%[6] |
|
Net approval rate |
-10%[6] |
-1% |
-5% |
-4% |
-7% |
10+/-6% |
+18%[6] |
[5] This survey was the Policy Address instant poll.
[6] Such changes have gone beyond the sampling errors at 95% confidence level, meaning that they are statistically significant prima facie. However, whether numerical differences are statistically significant is not the same as whether they are practically useful or meaningful, and different weighting methods could have been applied in different surveys.
The latest survey showed that CE Carrie Lam scored 56.4 marks, and 49% supported her as CE, her net approval rate is positive 10 percentage points.
Recent popularity figures of the HKSAR Government as well as people’s appraisal of society's conditions are summarized as follows:
|
Date of survey |
18-23/7/18 |
20-22/8/18 |
18-20/9/18 |
22-24/10/18 |
15-19/11/18 |
17-20/12/18 |
Latest change |
|
Sample size[7] |
1,002 |
1,022 |
1,002 |
1,006 |
1,000 |
1,000 |
-- |
|
Response rate |
49.0% |
53.0% |
55.6% |
63.4% |
67.9% |
60.6% |
-- |
|
Latest findings |
Finding |
Finding |
Finding |
Finding |
Finding |
Finding & error |
-- |
|
Satisfaction rate of SARG performance[8] |
32%[9] |
37% |
37% |
37% |
35% |
42+/-4% |
+7%[9] |
|
Dissatisfaction rate of SARG performance[8] |
43% |
40% |
45% |
42% |
46% |
36+/-4% |
-10%[9] |
|
Net satisfaction rate |
-11%[9] [10] |
-3% |
-8% |
-4% |
-11% |
5+/-8% |
+17%[9] |
|
Mean value[8] |
2.7[9] [10] |
2.8 |
2.8 |
2.8 |
2.7 |
3.0+/-0.1 |
+0.3[9] |
|
Current economic condition:
|
-- |
40% |
40% |
33%[9] |
37%[9] |
40+/-3% |
+2% |
|
Current economic condition:
|
-- |
33% |
37%[9] |
42%[9] |
39% |
32+/-3% |
-7%[9] |
|
Net satisfaction rate |
-- |
7% |
2% |
-9%[9] |
-2% |
8+/-5% |
+10%[9] |
|
Mean value[8] |
-- |
3.0 |
2.9 |
2.8[9] |
2.9 |
3.0+/-0.1 |
+0.2[9] |
|
Current livelihood condition:
|
-- |
29% |
30% |
27% |
25% |
30+/-3% |
+6%[9] |
|
Current livelihood condition:
|
-- |
51% |
50% |
52% |
53% |
46+/-3% |
-7%[9] |
|
Net satisfaction rate |
-- |
-23% |
-20% |
-25% |
-28% |
-16+/-5% |
+12%[9] |
|
Mean value[8] |
-- |
2.6 |
2.6 |
2.6 |
2.5 |
2.7+/-0.1 |
+0.2[9] |
|
Current political condition:
|
-- |
16% |
21%[9] |
18% |
19% |
20+/-3% |
+1% |
|
Current political condition:
|
-- |
63% |
57%[9] |
59% |
58% |
56+/-3% |
-2% |
|
Net satisfaction rate |
-- |
-47% |
-37%[9] |
-41% |
-39% |
-36+/-5% |
+3% |
|
Mean value[8] |
-- |
2.2 |
2.3[9] |
2.2 |
2.2 |
2.4+/-0.1 |
+0.1 |
[7] The question on the satisfaction of SARG performance only uses sub-samples of the surveys concerned. The sub-sample size for this survey is 513.
[8] Collapsed from a 5-point scale. The mean value is calculated by quantifying all individual responses into 1, 2, 3, 4, 5 marks according to their degree of positive level, where 1 is the lowest and 5 the highest, and then calculate the sample mean. Since October 2018, POP started to conduct tests on the wordings used in different rating scales. Figures in the table are the combined results. Please visit the POP Site for details.
[9] Such changes have gone beyond the sampling errors at 95% confidence level, meaning that they are statistically significant prima facie. However, whether numerical differences are statistically significant is not the same as whether they are practically useful or meaningful, and different weighting methods could have been applied in different surveys.
[10] Such changes have gone beyond the sampling errors at 95% confidence level because of a change in the weighting method. If the new weighting method was used on the previous dataset, the changes would not have gone beyond the sampling errors.
Regarding people’s appraisal of the overall performance of the HKSAR Government, the latest figures revealed that 42% were satisfied, whereas 36% were dissatisfied, thus net satisfaction stands at positive 5 percentage points. The mean score is 3.0, which is close to “half-half” in general. As for people’s satisfaction with the current economic, livelihood and political conditions, the latest satisfaction rates were 40%, 30% and 20% respectively, while their net satisfaction rates in these conditions were positive 8, negative 16 and negative 36 percentage points. The mean scores of the economic, livelihood and political conditions were 3.0, 2.7 and 2.4, meaning between “half-half” and “quite dissatisfied” in general.
Recent figures on people’s appraisal of the five specific policy areas of the HKSAR Government are tabulated as follows, in descending order of net satisfaction rates:
|
Date of survey |
16-20/3/17 |
19-22/6/17 |
18-19/12/17 |
14-21/6/18 |
17-20/12/18 |
Latest change |
|
Sample size[11] |
571-623 |
542-634 |
569-652 |
588-666 |
512-540 |
-- |
|
Response rate |
72.2% |
71.2% |
64.9% |
59.6% |
60.6% |
-- |
|
Latest findings |
Finding |
Finding |
Finding |
Finding |
Finding & error |
-- |
|
Relation with the Central Government: Satisfaction rate [12] |
43%[13] |
37%[13] |
52%[13] |
52% |
56+/-4% |
+4% |
|
Relation with the Central Government: Dissatisfaction rate[12] |
39% |
36% |
26%[13] |
33%[13] |
26+/-4% |
-7%[13] |
|
Net satisfaction rate |
4% |
1% |
26%[13] |
19% |
31+/-8% |
+12%[13] |
|
Mean value[12] |
2.9 |
2.9 |
3.3[13] |
3.2 |
3.4+/-0.1 |
+0.2[13] |
|
Maintaining economic prosperity: Satisfaction rate [12] |
40% |
38% |
44%[13] |
46% |
48+/-4% |
+3% |
|
Maintaining economic prosperity: Dissatisfaction rate [12] |
34%[13] |
35% |
26%[13] |
35%[13] |
31+/-4% |
-4% |
|
Net satisfaction rate |
6%[13] |
2% |
18%[13] |
10%[13] |
17+/-8% |
+7% |
|
Mean value[12] |
3.0 |
3.0 |
3.1 |
3.0 |
3.1+/-0.1 |
+0.1 |
|
Protecting human rights and freedom: Satisfaction rate [12] |
32% |
36% |
36% |
36% |
35+/-4% |
-1% |
|
Protecting human rights and freedom: Dissatisfaction rate[12] |
50% |
43%[13] |
44% |
49%[13] |
46+/-4% |
-3% |
|
Net satisfaction rate |
-18% |
-7%[13] |
-8% |
-13% |
-11+/-8% |
+2% |
|
Mean value[12] |
2.6 |
2.8[13] |
2.7 |
2.7 |
2.7+/-0.1 |
-- |
|
Improving people’s livelihood: Satisfaction rate [12] |
31%[13] |
26%[13] |
39%[13] |
34%[13] |
33+/-4% |
-1% |
|
Improving people’s livelihood: Dissatisfaction rate [12] |
49% |
49% |
38%[13] |
47%[13] |
46+/-4% |
-1% |
|
Net satisfaction rate |
-18%[13] |
-22% |
1%[13] |
-13%[13] |
-13+/-8% |
-- |
|
Mean value[12] |
2.7 |
2.6 |
2.9[13] |
2.7[13] |
2.7+/-0.1 |
-- |
|
Pace of democratic development: Satisfaction rate [12] |
24% |
25% |
30%[13] |
29% |
34+/-4% |
+5% |
|
Pace of democratic development: Dissatisfaction rate [12] |
57%[13] |
52%[13] |
49% |
55%[13] |
50+/-4% |
-5% |
|
Net satisfaction rate |
-33% |
-27% |
-18%[13] |
-26%[13] |
-16+/-8% |
+10% |
|
Mean value[12] |
2.4 |
2.5 |
2.6 |
2.4[13] |
2.6+/-0.1 |
+0.2 |
[11] These questions only use sub-samples of the surveys concerned.
[12] Collapsed from a 5-point scale. The mean value is calculated by quantifying all individual responses into 1, 2, 3, 4, 5 marks according to their degree of positive level, where 1 is the lowest and 5 the highest, and then calculate the sample mean. Since October 2018, POP started to conduct tests on the wordings used in different rating scales. Figures in the table are the combined results. Please visit the POP Site for details.
[13] Such changes have gone beyond the sampling errors at 95% confidence level, meaning that they are statistically significant prima facie. However, whether numerical differences are statistically significant is not the same as whether they are practically useful or meaningful, and different weighting methods could have been applied in different surveys.
Of the 5 specific policy areas, people were most satisfied with the Government’s performance in handling its relation with the Central Government, with a net satisfaction rate of positive 31 percentage points. The Government’s performance in maintaining economic prosperity followed, attaining a net satisfaction rate of positive 17 percentage points. That in protecting human rights and freedom and improving people’s livelihood attained net satisfaction rates of negative 11 and negative 13 percentage points respectively. Lastly, the net satisfaction rate of the Government’s pace of democratic development stands at negative 16 percentage points. The mean scores of these 5 specific areas are 3.4, 3.1, 2.7, 2.7 and 2.6 respectively, which are in between “quite satisfied” and “quite dissatisfied” in general.
Opinion Daily
In 2007, POP started collaborating with Wisers Information Limited whereby Wisers supplies to POP a record of significant events of that day according to the research method designed by POP. These daily entries would then be uploaded to “Opinion Daily” after they are verified by POP.
For some of the polling items covered in this press release, the previous survey was conducted from 14 to 21 June, 2018 while this survey was conducted from 17 to 20 December, 2018. During this period, herewith the significant events selected from counting newspaper headlines and commentaries on a daily basis and covered by at least 25% of the local newspaper articles. Readers can make their own judgment if these significant events have any impacts to different polling figures.
|
17/12/18 |
Chief Executive Carrie Lam pays a duty visit to Beijing. |
|
5/12/18 |
MTR Corporation agrees to dig up platform slabs at Hung Hom station to assess the built structures. |
|
25/11/18 |
Chan Hoi-yan wins Legislative Council Kowloon West by-election. |
|
19/11/18 |
The trial of nine protesters of the Occupy Central charged with public nuisance related offences starts today. |
|
19/11/18 |
Commission on Poverty announces 1.37 million people in Hong Kong are living in poverty, which reaches a 9-year high. |
|
12/11/18 |
Carrie Lam leads a delegation to visit Beijing and meets Xi Jinping. |
|
10/11/18 |
Some tours that visit Hong Kong via the Hong Kong-Zhuhai-Macao Bridge are suspected to have violated regulations. |
|
1/11/18 |
The Public Transport Fare Subsidy Scheme will be implemented next year. |
|
31/10/18 |
The Environment Bureau will introduce the Charging for Municipal Solid Waste Bill into the Legislative Council soon. |
|
24/10/18 |
The Hong Kong-Zhuhai-Macao Bridge officially commences operation. |
|
16/10/18 |
The traffic is paralyzed as four MTR lines encounter signalling issues. |
|
14/10/18 |
People protest against Lantau Tomorrow Vision. |
|
12/10/18 |
The returning officer declares Lau Siu-lai’s nomination for Legislative Council Kowloon West by-election invalid. |
|
10/10/18 |
Chief Executive Carrie Lam delivers the 2018 Policy Address. |
|
28/9/18 |
Price Indices of Private Domestic Property fall for the first time in 29 months. |
|
27/9/18 |
Hong Kong Banks increase prime rate for the first time in twelve years. |
|
24/9/18 |
An order banning the Hong Kong National Party’s operation is gazetted by the government. |
|
22/9/18 |
The Hong Kong Section of Express Rail Link will be launched on September 23. |
|
17/9/18 |
The traffic is paralyzed in the first working day after Super Typhoon Mangkhut hit Hong Kong. |
Public Sentiment Index
Background
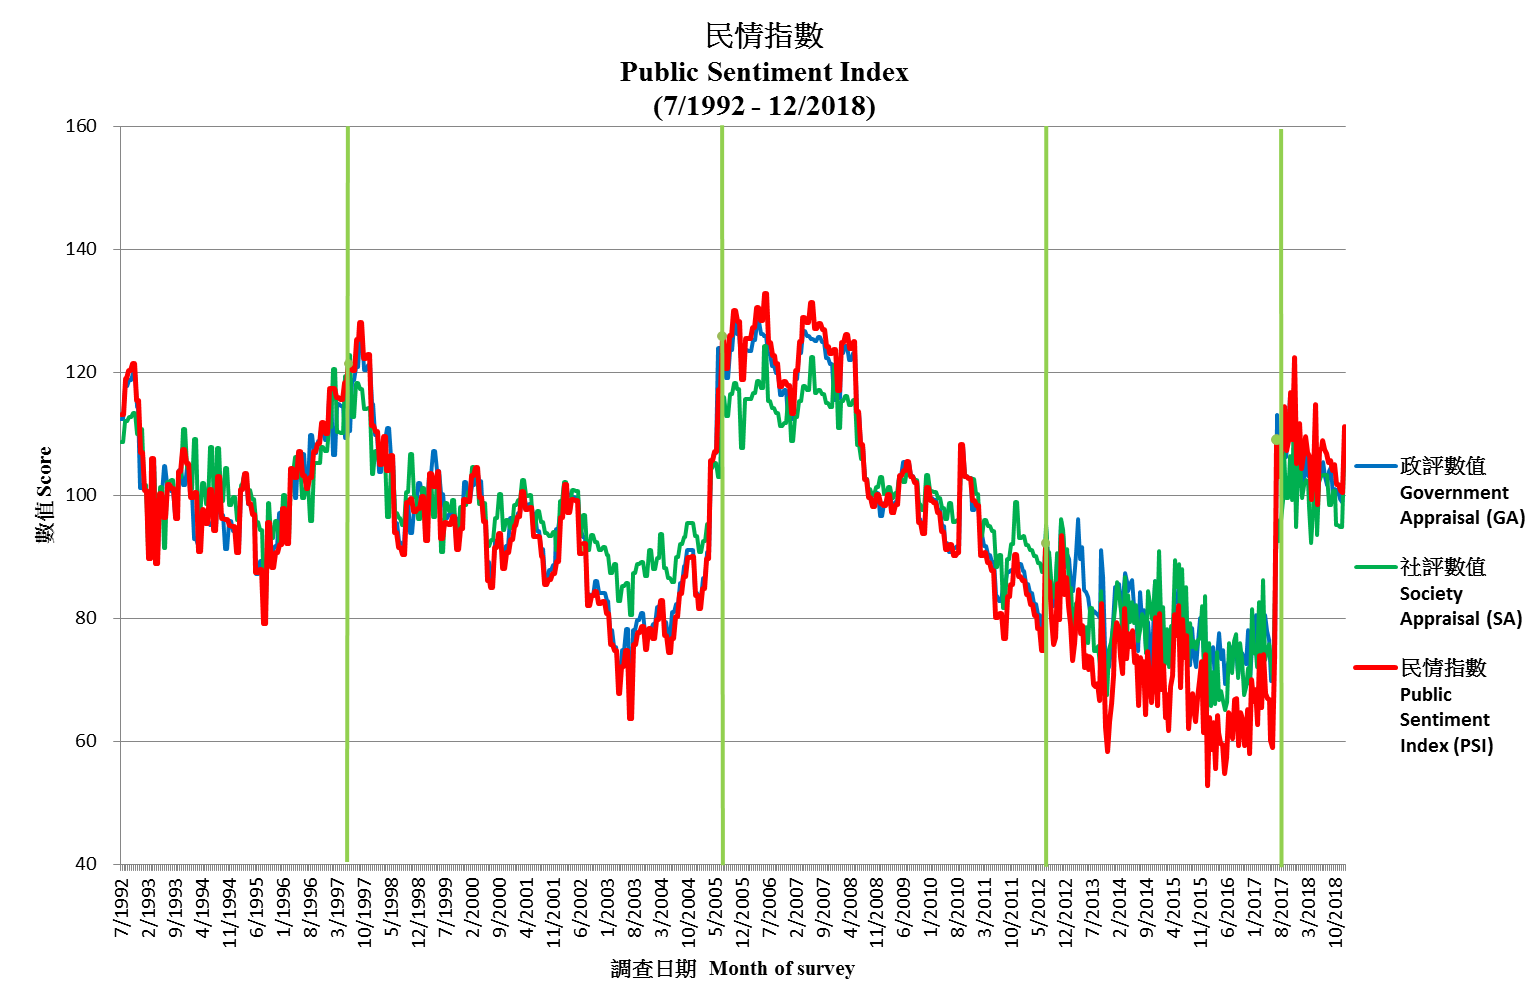
The Public Sentiment Index (PSI) compiled by POP aims at quantifying Hong Kong people’s sentiments, in order to explain and predict the likelihood of collective behaviour. PSI comprises 2 components: one being Government Appraisal (GA) Score and the other being Society Appraisal (SA) Score. GA refers to people’s appraisal of society’s governance while SA refers to people’s appraisal of the social environment. Both GA and SA scores are compiled from a respective of 4 and 6 opinion survey figures. All PSI, GA and SA scores range between 0 to 200, with 100 meaning normal, the grading reference of the scores are shown below. For methodological detailed please refer to the HKU POP Site at http://hkupop.pori.hk.
At the end of June 2012, before the 15th anniversary of the handover of Hong Kong, POP officially released a PSI analysis with figures dating back to 1992, spanning over 20 years. Moreover, the frequency of the study was set at twice a month. Currently, the cut-off dates of all PSI analyses are set at the Sundays proceeding every 15th and last day of month. The first analysis of each month would be released through the POP Site at the Thursday following the cut-off date, while the second analysis would be released at the first Tuesday of the following month through the POP Site and press release.
Latest Figures of PSI
The PSI released by POP today shows that as of December 30, 2018, the latest Public Sentiment Index (PSI) is 111.3, up 10.7 from early December. As for the Government Appraisal (GA) and Society Appraisal (SA), the scores are 107.2 and 105.8, up by 8.3 and 11.0 respectively. The chart of PSI, GA and SA are shown below:
|
|
|||
|
Latest figure |
Public Sentiment Index
|
Government Appraisal
|
Society Appraisal
|
Recent values of PSI, GA, SA and 10 fundamental figures are tabulated as follows:
|
Release date |
11/10/18 |
6/11/18 |
15/11/18 |
4/12/18 |
13/12/18 |
2/1/19 |
Latest change |
|
Cut-off date |
7/10/18 |
28/10/18 |
11/11/18 |
25/11/18 |
9/12/18 |
30/12/18 |
-- |
|
Public Sentiment Index (PSI) |
104.9 |
101.8 |
101.8 |
100.7 |
100.5 |
111.3 |
+10.7 |
|
Government Appraisal (GA) |
101.0 |
100.9 |
100.8 |
99.3 |
99.0 |
107.2 |
+8.3 |
|
Rating of CE |
52.3 |
51.7 |
52.3 |
50.2 |
50.2 |
56.4 |
+6.2 |
|
Net approval rate of CE |
4% |
-1% |
-5% |
-4% |
-7% |
10% |
+18% |
|
Mean value of people’s satisfaction with SARG [14] |
2.8[15] |
2.8 |
2.8[15] |
2.7 |
2.7[15] |
3.0 |
+0.3 |
|
Mean value of people’s trust in SARG[14] |
3.0[15] |
3.0[15] |
3.0[15] |
3.0 |
3.0[15] |
3.0[15] |
-- |
|
Society Appraisal (SA) |
100.6[15] |
95.2 |
95.2[15] |
94.8 |
94.8[15] |
105.8 |
+11.0 |
|
People’s satisfaction with political condition [14] |
2.3[15] |
2.2 |
2.2[15] |
2.2 |
2.2[15] |
2.4 |
+0.1 |
|
Weighting index of political condition |
0.31[15] |
0.31[15] |
0.31[15] |
0.31[15] |
0.31[15] |
0.30 |
-- |
|
People’s satisfaction with economic condition [14] |
2.9[15] |
2.8 |
2.8[15] |
2.9 |
2.9[15] |
3.0 |
+0.2 |
|
Weighting index of economic condition |
0.34[15] |
0.34[15] |
0.34[15] |
0.34[15] |
0.34[15] |
0.34 |
-- |
|
People’s satisfaction with livelihood condition [14] |
2.6[15] |
2.6 |
2.6[15] |
2.5 |
2.5[15] |
2.7 |
+0.2 |
|
Weighting index of livelihood condition |
0.35[15] |
0.35[15] |
0.35[15] |
0.35[15] |
0.35[15] |
0.35 |
-- |
[14] Since October 2018, POP started to conduct tests on the wordings used in different rating scales. Figures in the table are the combined results. Please visit the POP Site for details.
[15] POP will adopt the latest published figures when there are no respective updates.
As for the meaning of the score values, please refer to the following:
|
Score value |
Percentile |
Score value |
Percentile |
|
140-200 |
Highest 1% |
0-60 |
Lowest 1% |
|
125 |
Highest 5% |
75 |
Lowest 5% |
|
120 |
Highest 10% |
80 |
Lowest 10% |
|
110 |
Highest 25% |
90 |
Lowest 25% |
|
100 being normal level, meaning half above half below |
|||
The latest PSI of 111.3 can be considered as among the best 23% across the past 20 years or so, while the GA and SA scores of 107.2 and 105.8 can be considered as among the best 31% and 35% respectively.
Commentary
Note: The following commentary was written by Senior Data Analyst of POP, Edward Tai.
Our latest survey shows that the popularity rating of CE Carrie Lam has surged compared to two weeks ago, by 6.2 to 56.4 marks. Her latest approval rate is 49%, disapproval rate 39%, giving a net popularity of positive 10 percentage points, also a significant increase of 18 percentage points compared to two weeks ago.
As for the SAR Government, its popularity has also significantly increased over the past month. Its satisfaction rate now stands at 42%, dissatisfaction rate 36%, giving a net satisfaction rate of positive 5 percentage points, 17 percentage points higher than a month ago. As for the society’s appraisals, among economic, livelihood and political conditions, people remain to be least satisfied with the current political condition. The corresponding net satisfactions are positive 8, negative 16 and negative 36 percentage points.
As for the five specific policy areas, in terms of net satisfaction rate, handling of its relation with the Central Government and maintaining economic prosperity registered positive values at positive 31 and positive 17 percentage points respectively. The other three items registered negative values, they are, protecting human rights and freedom, improving people’s livelihood and developing democracy, at negative 11, negative 13 and negative 16 percentage points respectively. Compared to six months ago, apart from improving people’s livelihood, the net satisfaction rates of other four indicators have increased. Among them, the increase in the net satisfaction rate of handling of its relation with the Central Government has gone beyond sampling errors.
As for the Public Sentiment Index (PSI), the latest PSI stands at 111.3, increased by 10.7 points since early December. This time both component scores of PSI have increased. Specifically, the Government Appraisal (GA) Score that reflects people’s appraisal of society’s governance goes up by 8.3 points to 107.2, whereas the Society Appraisal (SA) Score that reflects people’s appraisal of the social environment increases by 11.0 points to 105.8. As for the reasons affecting the ups and downs of these figures, we leave it to our readers to form their own judgment using detailed records displayed in our “Opinion Daily”.
Future Release (Tentative)
Reference Materials on Survey on PSI Please refer to the HKU POP Site at http://hkupop.pori.hk.
|


