


HKU POP releases the latest social indicators and the PSIBack
Press Release on November 6, 2018
| Detailed Findings (Social Indicators) | (Rule of law indicators) |
| Detailed Findings (Public Sentiment Index Feature Page) |
Special Announcements
1. From July 2017, apart from sampling landline numbers to conduct opinion surveys, the Public Opinion Programme (POP) of The University of Hong Kong has also added mobile numbers to the sampling frame. After three months of testing, in October 2017, POP formalized the use of mixed samples as its standard for regular opinion surveys using a landline and mobile sample ratio of 4 to 1. Starting from April 2018, POP further increased the proportion of mobile sample, which the landline and mobile sample ratio became 2 to 1. The figures released today by POP have already incorporated landline and mobile samples.
2. In September 2017, POP started to use “effective response rate” to report surveys’ contact information. In July 2018, POP further revised the calculation of effective response rate. Thus, the response rates before and after the change cannot be directly compared.
3. To facilitate academic study and rational discussion, POP has already released for public examination some time ago via the “HKU POP SITE” (http://hkupop.pori.hk) the raw data of regular rating surveys of current CE Carrie Lam, former CEs CH Tung, Donald Tsang and CY Leung, along with related demographics of respondents. Please follow normal academic standards when using or citing such data.
Abstract
POP interviewed 1,006 Hong Kong people between 22 and 24 October 2018 by means of a random telephone survey conducted by real interviewers. Our latest survey shows that people now appraised the Hong Kong society more negatively than five months ago. Among the five core social indicators, Hong Kong’s degree of “stability” and “prosperity” scored the highest ratings, followed by “freedom” and “compliance with rule of law”, and finally “democracy”. Apart from “stability”, the remaining four indicators have dropped significantly. The ratings of “freedom” and “democracy” have even dropped to their record low since the survey questions were first asked in 1997. As for the results of other social indicators including non-core social indicators, freedom and law sub-indicators, they will be released in this survey series next time. The maximum sampling error of various indicators is +/-0.22 marks at 95% confidence level. The response rate of the survey is 63%.
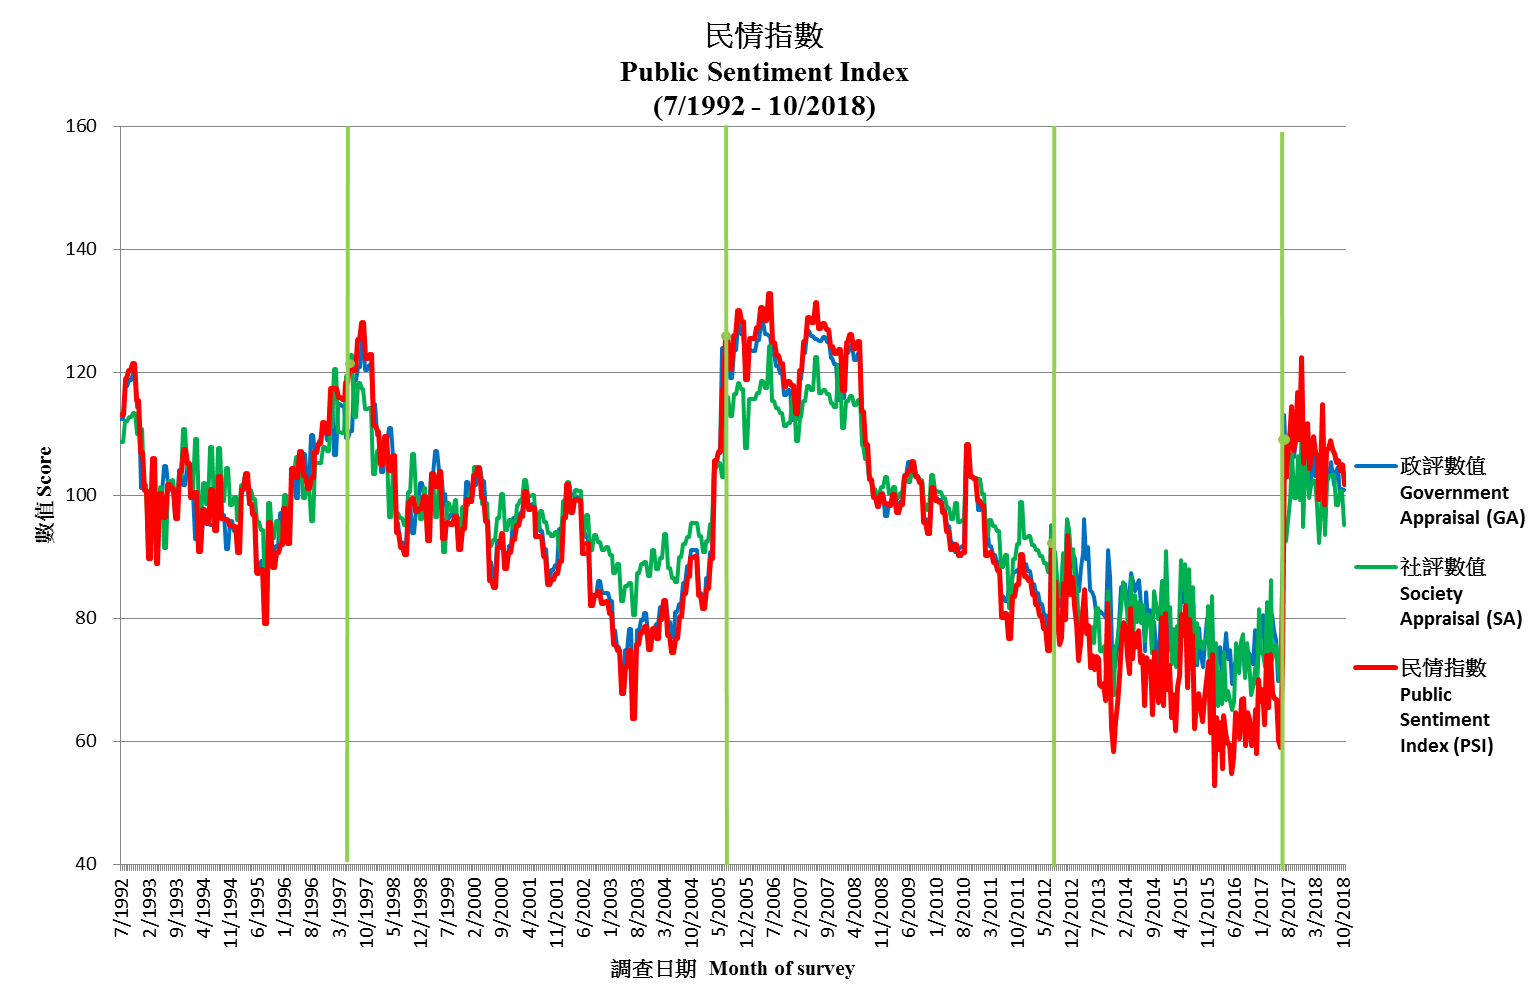
As for the Public Sentiment Index (PSI), the latest PSI stands at 101.8, decreased by 3.1 points since early October. This time both component scores of PSI have decreased. Specifically, the Government Appraisal (GA) Score that reflects people’s appraisal of society’s governance decreases by 0.1 point to 100.9, whereas the Society Appraisal (SA) Score that reflects people’s appraisal of the social environment goes down by 5.5 points to 95.2.
Points to note:
[1] The address of the “HKU POP SITE” is http://hkupop.pori.hk, journalists can check out the details of the survey there.
[2] The sample size of this survey is 1,006 successful interviews, not 1,006 x 63.4% response rate. In the past, many media made this mistake.
[3] “95% confidence level” means that if we were to repeat a certain survey 100 times, using the same questions each time but with different random samples, we would expect 95 times getting a figure within the error margins specified. When quoting these figures, journalists can state “sampling error of various indicators not more than +/-0.22 at 95% confidence level”.
[4] Because of sampling errors in conducting the survey(s) and the rounding procedures in processing the data, the figures cannot be too precise, and the totals may not be completely accurate. Therefore, when quoting percentages of the survey(s), journalists should refrain from reporting decimal places, but when quoting the rating figures, one decimal place can be used.
[5] The data of this survey is collected by means of random telephone interviews conducted by real interviewers, not by any interactive voice system (IVS). If a research organization uses “computerized random telephone survey” to camouflage its IVS operation, it should be considered unprofessional.
I. Social Indicators
Latest Figures
POP today releases the latest results of 5 core indicators of social indicators. From July 2018, 5 core indicators continue to be released once every half-year, while 7 non-core indicators, 10 freedom sub-indicators, 2 rule of law sub-indicators, and the rating of Chief Justice have been changed to be released once every year. Besides, from July 2017, POP enhanced the previous weighting method that has been used for quite a few years. Apart from age, gender and education, economic activity group is now also taken into account when adjusting data. The latest figures released today have been rim-weighted according to figures provided by the Census and Statistics Department. The gender-age distribution of the Hong Kong population came from “Mid-year population for 2017”, while the educational attainment (highest level attended) distribution and economic activity status distribution came from “Women and Men in Hong Kong - Key Statistics (2018 Edition)”. In the past, the mobile sample would be rim-weighted according to the basic Public Sentiment Index (PSI) figures collected in the landline sample. In July 2018, POP further refined the weighting method. The landline sample and the mobile sample would no longer be processed separately. The mobile sample would also no longer be adjusted using the basic PSI figures collected in the landline sample. The overall effect is that the importance of the mobile sample would be increased. Herewith the contact information for the latest survey:
|
Date of survey |
Sample size |
Effective response rate |
Maximum sampling error
|
|
22-24/10/2018 |
1,006 |
63.4% |
+/-0.22 |
[6] Errors are calculated at 95% confidence level using full sample size. “95% confidence level” means that if we were to repeat a certain survey 100 times, using the same questions each time but with different random samples, we would expect 95 times getting a figure within the error margins specified.
Herewith the latest figures of the 5 core social indicators:
|
Date of survey |
6-9/2/17 |
10-13/7/17 |
15-18/1/18 |
4-9/5/18 |
22-24/10/18 |
Latest change |
|
Sample size[7] |
1,029 |
804 |
1,035 |
1,017 |
1,006 |
-- |
|
Response rate* |
70.5% |
72.0% |
63.6% |
59.5% |
63.4% |
-- |
|
Finding |
Finding |
Finding |
Finding |
Finding |
Finding & error[8] |
-- |
|
Degree of stability |
6.41 |
6.83[9] |
6.65[9] |
6.59 |
6.61+/-0.18 [10] |
+0.02 |
|
Degree of prosperity |
6.63[9] |
7.03[9] |
6.93 |
7.21[9] |
6.61+/-0.17 [10] |
-0.60[9] |
|
Degree of freedom |
6.90[9] |
7.07[9] |
6.72[9] |
7.11[9] |
6.57+/-0.20 |
-0.53[9] |
|
Compliance with the rule of law |
6.63[9] |
7.08[9] |
6.29[9] |
6.74[9] |
6.21+/-0.19 |
-0.53[9] |
|
Degree of democracy |
6.02 |
6.39[9] |
5.74[9] |
5.65 |
5.10+/-0.22 |
-0.55[9] |
* “Overall response rate” was used before September 2017, thereafter, “effective response rate” was used. In July 2018, POP revised the calculation of effective response rate. Thus, the response rates before and after the change cannot be directly compared.
[7] Except in the survey conducted during 4-9/5/18, these questions only use sub-samples of the surveys concerned. The sub-sample sizes of this survey range from 523 to 554, and the increased sampling errors have already been reflected in the figures tabulated.
[8] All error figures in the table are calculated at 95% confidence level. “95% confidence level” means that if we were to repeat a certain survey 100 times, using the same questions each time but with different random samples, we would expect 95 times getting a figure within the error margins specified. Media can state “sampling error of various ratings not more than +/-0.22 at 95% confidence level” when quoting the above figures.
[9] Such changes have gone beyond the sampling errors at the 95% confidence level, meaning that they are statistically significant prima facie. However, whether numerical differences are statistically significant is not the same as whether they are practically useful or meaningful, and different weighting methods could have been applied in different surveys.
[10] In three decimal places, the rating of “stability” is 6.613 and that of “prosperity” is 6.611.
[11] Since October 2018, POP started to conduct tests on the wordings used in different rating scales. Figures in the table are the combined results. Please visit the POP Site for details.
Latest results showed that, on a scale of 0-10, Hong Kong’s degree of “stability” and “prosperity” scored the highest ratings, each with 6.61 marks, followed by “freedom” and “compliance with rule of law”, with 6.57 and 6.21 marks respectively, and finally “democracy”, with 5.10 marks.
Opinion Daily
In January 2007, POP opened a feature page called “Opinion Daily” at the “POP Site”, to record significant events and selected polling figures on a day-to-day basis, in order to let readers judge by themselves the reasons for the ups and downs of different opinion figures. In July 2007, POP collaborated with Wisers Information Limited whereby Wisers supplies to POP each day starting from July 24, a record of significant events of that day, according to the research method designed by POP. These daily entries would be uploaded to “Opinion Daily” as soon as they are verified by POP.
For the polling items covered in this press release, the previous survey was conducted from May 4 to 9, 2018 while this survey was conducted from October 22 to 24, 2018. During this period, herewith the significant events selected from counting newspaper headlines and commentaries on a daily basis and covered by at least 25% of the local newspaper articles. Readers can make their own judgment if these significant events have any impacts to different polling figures.
|
24/10/18 |
The Hong Kong-Zhuhai-Macao Bridge officially commences operation. |
|
16/10/18 |
The traffic is paralyzed as four MTR lines encounter signalling issues. |
|
14/10/18 |
People protest against Lantau Tomorrow Vision. |
|
12/10/18 |
The returning officer declares Lau Siu-lai’s nomination for Legislative Council Kowloon West by-election invalid. |
|
11/10/18 |
Hong Kong stock market drops sharply after US falls. |
|
10/10/18 |
Chief Executive Carrie Lam delivers the 2018 Policy Address. |
|
28/9/18 |
Price Indices of Private Domestic Property fall for the first time in 29 months. |
|
27/9/18 |
Hong Kong Banks increase prime rate for the first time in twelve years. |
|
24/9/18 |
An order banning the Hong Kong National Party’s operation is gazetted by the government. |
|
22/9/18 |
The Hong Kong Section of Express Rail Link will be launched on September 23. |
|
17/9/18 |
The traffic is paralyzed in the first working day after Super Typhoon Mangkhut hit Hong Kong. |
|
16/9/18 |
Super Typhoon Mangkhut hits Hong Kong. |
|
7/9/18 |
Thirteen protesters who oppose North East New Territories development plan win their appeal at the Court of Final Appeal. |
|
10/8/18 |
Buildings near the construction site of Exhibition Centre Station of MTR Shatin to Central Link are found to be affected by land subsidence. |
|
9/8/18 |
Buildings near the construction site of To Kwa Wan Station are found to be affected by land subsidence. |
II. Public Sentiment Index
Background
The Public Sentiment Index (PSI) compiled by POP aims at quantifying Hong Kong people’s sentiments, in order to explain and predict the likelihood of collective behaviour. PSI comprises 2 components: one being Government Appraisal (GA) Score and the other being Society Appraisal (SA) Score. GA refers to people’s appraisal of society’s governance while SA refers to people’s appraisal of the social environment. Both GA and SA scores are compiled from a respective of 4 and 6 opinion survey figures. All PSI, GA and SA scores range between 0 to 200, with 100 meaning normal, the grading reference of the scores are shown below. For methodological detailed please refer to the HKU POP Site at http://hkupop.pori.hk.
POP started to pilot study the “Public Sentiment Index” in year 2010 in collaboration with NowTV. The first survey was conducted in June 2010, followed by a series of monthly tracking surveys in 2011. There were altogether 13 surveys, covered by 11 releases from March 2011 to January 2012. All results have been uploaded to the POP Site.
At the end of June 2012, before the 15th anniversary of the handover of Hong Kong, POP officially released a “PSI analysis” with figures dating back to 1992, spanning over 20 years. Moreover, the frequency of the study was set at twice a month. In October 2012, echoing the start of a new Legislative Council, POP decided to set the cut-off date of all PSI analyses at the Sunday proceeding every 15th and last day of month, whereas the release date was set at the first Thursday following the cut-off date. In July 2017, after the 20th anniversary of the handover, POP further streamlined the release date and mode of PSI analyses to become POP Site release only for the first analysis of each month, and POP Site plus press release for the second analysis of each month. At the same time, the second release was shifted to the first Tuesday of the following month, except under special circumstances.
Cut-off date of the PSI figures released by POP today is October 28, 2018, while that of the next round of release will be November 11, 2018. The tentative release date for the next release will be November 15, 2018 (Thursday).
Latest Figures of PSI
The PSI released by POP today shows that as of October 28, 2018, the latest Public Sentiment Index (PSI) is 101.8, down 3.1 from early October. As for the Government Appraisal (GA) and Society Appraisal (SA), the scores are 100.9 and 95.2, down by 0.1 and 5.5 respectively. The chart of PSI, GA and SA are shown below:
|
|
|||
|
Latest figure |
Public Sentiment Index
|
Government Appraisal
|
Society Appraisal
|
Recent values of PSI, GA, SA and 10 fundamental figures are tabulated as follows:
|
Release date |
16/8/18 |
4/9/18 |
13/9/18 |
2/10/18 |
11/10/18 |
6/11/18 |
Latest change[13] |
|
Cut-off date |
12/8/18 |
26/8/18 |
9/9/18 |
23/9/18 |
7/10/18 |
28/10/18 |
-- |
|
Public Sentiment Index (PSI) |
106.8 |
105.3 |
105.7 |
104.0 |
104.9 |
101.8 |
-3.1 |
|
Government Appraisal (GA) |
101.8 |
103.9 |
104.6 |
99.4 |
101.0 |
100.9 |
-0.1 |
|
Rating of CE |
55.4 |
55.3 |
57.3 |
50.8 |
52.3 |
51.7 |
-0.7 |
|
Net approval rate of CE |
1% |
14% |
10% |
-4% |
4% |
-1% |
-5% |
|
Mean value of people’s satisfaction with SARG [14] |
2.7[12] |
2.8 |
2.8[12] |
2.8 |
2.8[12] |
2.8 |
+0.1 |
|
Mean value of people’s trust in SARG |
3.0[12] |
3.0[12] |
3.0[12] |
3.0[12] |
3.0[12] |
3.0 [12] |
-- |
|
Society Appraisal (SA) |
103.3[12] |
98.4 |
98.4[12] |
100.6 |
100.6[12] |
95.2 |
-5.5 |
|
People’s satisfaction with political condition [14] |
2.3[12] |
2.2 |
2.2[12] |
2.3 |
2.3[12] |
2.2 |
-0.1 |
|
Weighting index of political condition |
0.31[12] |
0.31[12] |
0.31[12] |
0.31[12] |
0.31[12] |
0.31[12] |
-- |
|
People’s satisfaction with economic condition [14] |
3.1[12] |
3.0 |
3.0[12] |
2.9 |
2.9[12] |
2.8 |
-0.1 |
|
Weighting index of economic condition |
0.34[12] |
0.34[12] |
0.34[12] |
0.34[12] |
0.34[12] |
0.34[12] |
-- |
|
People’s satisfaction with livelihood condition [14] |
2.7[12] |
2.6 |
2.6[12] |
2.6 |
2.6[12] |
2.6 |
-0.1 |
|
Weighting index of livelihood condition |
0.35[12] |
0.35[12] |
0.35[12] |
0.35[12] |
0.35[12] |
0.35[12] |
-- |
[12] POP will adopt the latest published figures when there are no respective updates.
[13] Latest changes are based on the differences between the exact values of the two figures, but not the rounded figures shown in the table.
[14] Since October 2018, POP started to conduct tests on the wordings used in different rating scales. Figures in the table are the combined results. Please visit the POP Site for details.
As for the meaning of the score values, please refer to the following:
|
Score value |
Percentile |
Score value |
Percentile |
|
140-200 |
Highest 1% |
0-60 |
Lowest 1% |
|
125 |
Highest 5% |
75 |
Lowest 5% |
|
120 |
Highest 10% |
80 |
Lowest 10% |
|
110 |
Highest 25% |
90 |
Lowest 25% |
|
100 being normal level, meaning half above half below |
|||
The latest PSI of 101.8 can be considered as among the best 45% across the past 20 years or so, while the GA and SA scores of 100.9 and 95.2 can be considered as among the best 48% and worst 37% respectively.
Commentary
Note: The following commentary was written by Research Manager of POP, Frank Lee.
Our latest survey shows that people now appraised the Hong Kong society more negatively than five months ago. Among the five core social indicators, Hong Kong’s degree of “stability” and “prosperity” scored the highest ratings, followed by “freedom” and “compliance with rule of law”, and finally “democracy”. Apart from “stability”, the remaining four indicators have dropped significantly. The ratings of “freedom” and “democracy” have even dropped to their record low since the survey questions were first asked in 1997. As for the results of other social indicators including non-core social indicators, freedom and law sub-indicators, they will be released in this survey series next time.
As for the Public Sentiment Index (PSI), the latest PSI stands at 101.8, decreased by 3.1 points since early October. This time both component scores of PSI have decreased. Specifically, the Government Appraisal (GA) Score that reflects people’s appraisal of society’s governance decreases by 0.1 point to 100.9, whereas the Society Appraisal (SA) Score that reflects people’s appraisal of the social environment goes down by 5.5 points to 95.2. As for the reasons affecting the ups and downs of these figures, we leave it to our readers to form their own judgment using detailed records displayed in our “Opinion Daily”.
Future Release (Tentative)
Reference Materials on Survey on PSI Please refer to the HKU POP Site at http://hkupop.pori.hk.
|


