


HKU POP releases people’s appraisal of local news media and the PSIBack
Press Release on September 4 , 2018
| Detailed Findings (People's Appraisal of the Local News Media) |
| Detailed Findings (Public Sentiment Index Feature Page) |
Special Announcements
1. From July 2017, apart from sampling landline numbers to conduct opinion surveys, the Public Opinion Programme (POP) of The University of Hong Kong has also added mobile numbers to the sampling frame. After three months of testing, in October 2017, POP formalized the use of mixed samples as its standard for regular opinion surveys using a landline and mobile sample ratio of 4 to 1. Starting from April 2018, POP further increased the proportion of mobile sample, which the landline and mobile sample ratio became 2 to 1. The figures released today by POP have already incorporated landline and mobile samples.
2. In September 2017, POP started to use “effective response rate” to report surveys’ contact information. In July 2018, POP further revised the calculation of effective response rate. Thus, the response rates before and after the change cannot be directly compared.
3. To facilitate academic study and rational discussion, POP has already released for public examination some time ago via the “HKU POP SITE” (http://hkupop.pori.hk) the raw data of regular rating surveys of current CE Carrie Lam, former CEs CH Tung, Donald Tsang and CY Leung, along with related demographics of respondents. Please follow normal academic standards when using or citing such data.
Abstract
POP interviewed 1,022 Hong Kong people between 20 and 22 August, 2018 by means of a random telephone survey conducted by real interviewers. The survey finds that among various types of news media, television and the internet remain to be people’s main sources of news. In terms of performance satisfaction, people are most satisfied with the performance of the radio, with net satisfaction standing at positive 42 percentage points. Television comes next with net satisfaction standing at positive 30 percentage points. Overall speaking, people’s net satisfaction with the performance of the news media in general now stands at positive 32 percentage points. Compared to four months ago, people’s net satisfaction with press freedom has increased by 10 percentage points to positive 22 percentage points, but the change has not gone beyond sampling error. The majority of people thought the media have scruples when criticizing the Central Government, the net value is positive 39 percentage points. The percentage of those who thought the media have scruples when criticizing the HKSAR Government is also higher than those who thought otherwise, and the net value is positive 7 percentage points. Meanwhile, 56% believe Hong Kong’s news media have practiced self-censorship, another 29% think the opposite, giving a net value of positive 27 percentage points, which also is a record high since the survey question was first asked in 1997. Besides, 29% and 39% consider the media responsible and irresponsible in their reporting respectively. More people think the media have given full play to press freedom, the net value has rebounded by 11 percentage points to positive 14 percentage points. At the same time, people also think that the media misused or abused press freedom, but its net value dropped by 12 percentage points and also stands at positive 14 percentage points. On a scale of 0-10, the latest general credibility rating of the news media stands at 5.89 marks. The maximum sampling error of all percentages is +/-4% at 95% confidence level, while the sampling errors of rating figures and net satisfaction rates need another calculation. The response rate of the survey is 53%.
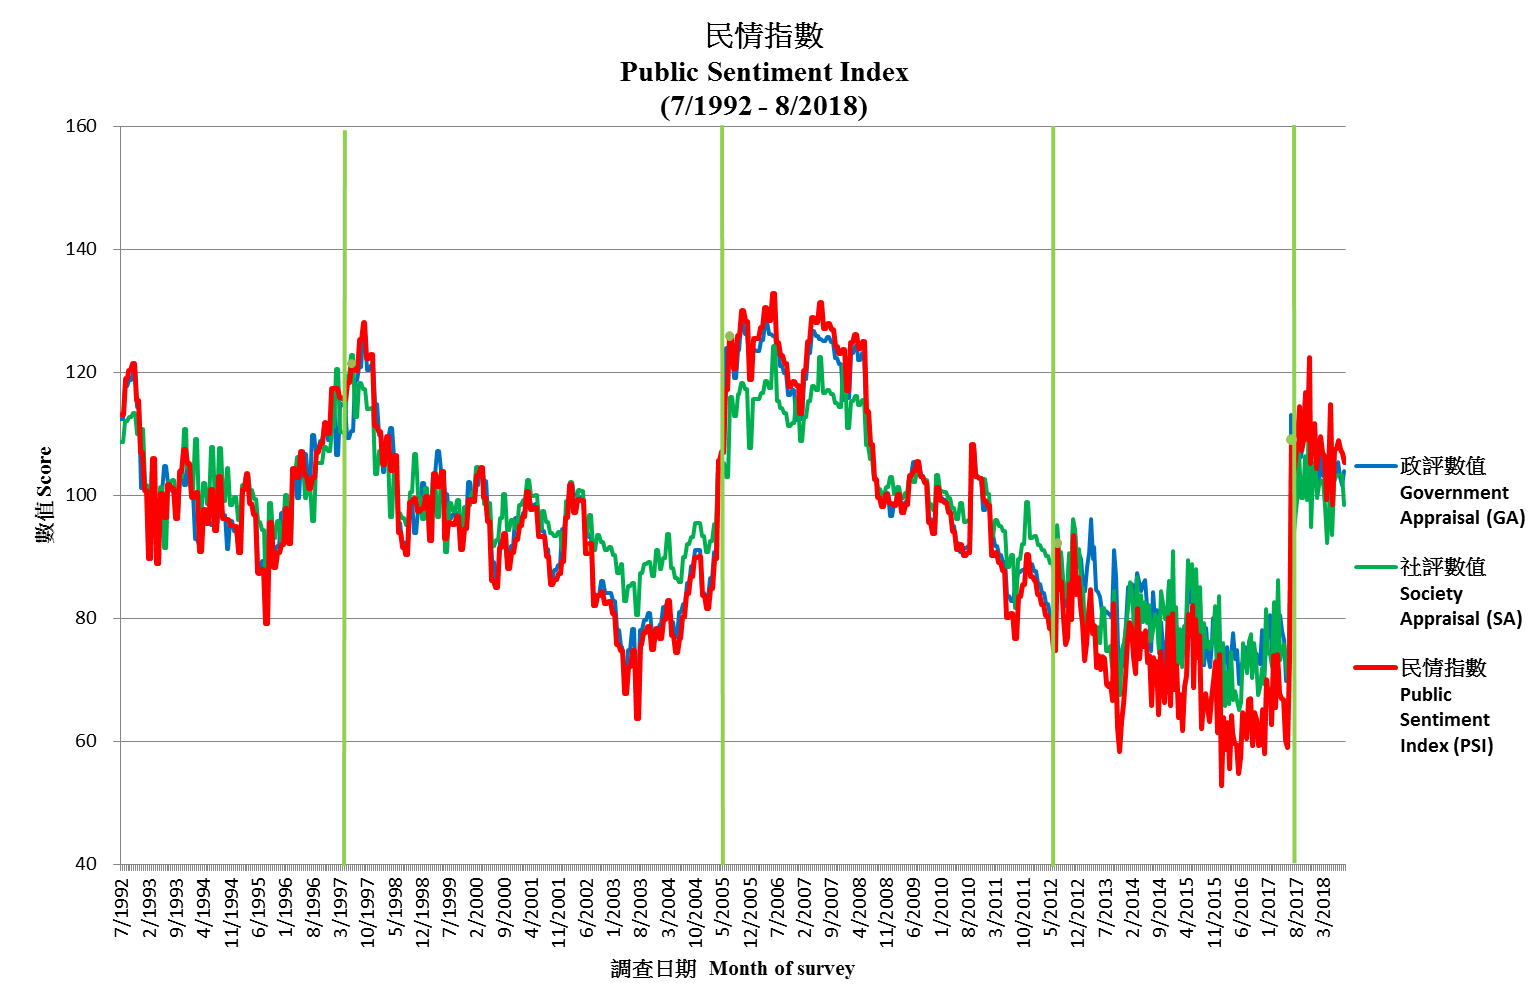
As for the Public Sentiment Index (PSI), the latest PSI stands at 105.3, decreased by 1.5 points since early August. This time the two component scores of PSI go in opposite directions. Specifically, the Government Appraisal (GA) Score that reflects people’s appraisal of society’s governance goes up by 2.2 points to 103.9, whereas the Society Appraisal (SA) Score that reflects people’s appraisal of the social environment decreases by 4.9 points to 98.4.
Points to note:
[1] The address of the “HKU POP SITE” is http://hkupop.pori.hk, journalists can check out the details of the survey there.
[2] The sample size of this survey is 1,022 successful interviews, not 1,022 x 53.0% response rate. In the past, many media made this mistake.
[3] “95% confidence level” means that if we were to repeat a certain survey 100 times, using the same questions each time but with different random samples, we would expect 95 times getting a figure within the error margins specified. When quoting these figures, journalists can state “sampling error of rating not more than +/-0.16, sampling error of percentages not more than +/-4%, and sampling error of net values not more than +/-8% at 95% confidence level”.
[4] Because of sampling errors in conducting the survey(s) and the rounding procedures in processing the data, the figures cannot be too precise, and the totals may not be completely accurate. Therefore, when quoting percentages of the survey(s), journalists should refrain from reporting decimal places, but when quoting the rating figures, one decimal place can be used.
[5] The data of this survey is collected by means of random telephone interviews conducted by real interviewers, not by any interactive voice system (IVS). If a research organization uses “computerized random telephone survey” to camouflage its IVS operation, it should be considered unprofessional.
I. People’s Appraisal of Local News Media
Latest Figures
From July 2017, POP enhanced the previous weighting method that has been used for quite a few years. Apart from age, gender and education, economic activity group is now also taken into account when adjusting data. The latest figures released today have been rim-weighted according to figures provided by the Census and Statistics Department. The gender-age distribution of the Hong Kong population came from “Mid-year population for 2017”, while the educational attainment (highest level attended) distribution and economic activity status distribution came from “Women and Men in Hong Kong - Key Statistics (2018 Edition)”. In the past, the mobile sample would be rim-weighted according to the basic Public Sentiment Index (PSI) figures collected in the landline sample. In July 2018, POP further refined the weighting method. The landline sample and the mobile sample would no longer be processed separately. The mobile sample would also no longer be adjusted using the basic PSI figures collected in the landline sample. The overall effect is that the importance of the mobile sample would be increased. Herewith the contact information for the latest survey:
|
Date of survey |
Sample size |
Effective response rate |
Maximum sampling error
|
|
20-22/8/2018 |
1,022 |
53.0% |
+/-3% |
[6] Errors are calculated at 95% confidence level using full sample size. “95% confidence level” means that if we were to repeat a certain survey 100 times, using the same questions each time but with different random samples, we would expect 95 times getting a figure within the error margins specified. Questions using only sub-samples would have bigger sampling error. Sampling errors of ratings are calculated according to the distribution of the scores collected.
Recent figures of people’s appraisal of the overall performance of news media are summarized as follows:
|
Date of survey |
10-12/4/17 |
3-4/10/17 |
2-4/4/18 |
20-22/8/18 |
Latest change |
|
Sample base[7] |
1,001 |
1,005 |
1,003 |
1,022 |
-- |
|
Response rate* |
72.3% |
59.5% |
57.9% |
53.0% |
-- |
|
Finding |
Finding |
Finding |
Finding |
Finding and error[8] |
-- |
|
Freedom of the press in HK: Satisfaction rate [9] |
55%[10] |
47%[10] |
48% |
52+/-4% |
+4% |
|
Freedom of the press in HK: Dissatisfaction rate [9] |
31%[10] |
32% |
36% |
30+/-4% |
-6%[10] [11] |
|
Net satisfaction rate |
24%[10] |
15%[10] |
12% |
22+/-8% |
+10% |
|
Mean value[9] |
3.3[10] (Base=649) |
3.2 (Base=524) |
3.1 (Base=615) |
3.2+/-0.1 (Base=535) |
+0.1 |
|
Perceived the local news media to be responsible in their reporting[9] |
33% |
30% |
25%[10] |
29+/-4% |
+5% |
|
Perceived the local news media to be irresponsible in their reporting[9] |
36% |
40% |
40% |
39+/-4% |
-1% |
|
Net value |
-3% |
-10% |
-15% |
-9+/-7% |
+6% |
|
Mean value[9] |
2.9 (Base=569) |
2.8 (Base=499) |
2.8 (Base=614) |
2.8+/-0.1 (Base=511) |
-- |
|
Perceived that the local news media had scruples when criticizing the Central Government |
58% |
67%[10] |
69% |
64+/-4% |
-5% |
|
Perceived that the local news media had no scruples when criticizing the Central Government |
33% |
25%[10] |
24% |
25+/-4% |
+1% |
|
Net value |
25% |
41%[10] |
45% |
39+/-7% |
-6% |
|
Perceived that the local news media had scruples when criticizing the HKSAR Government |
44%[10] |
51%[10] |
53% |
50+/-4% |
-3% |
|
Perceived that the local news media had no scruples when criticizing the HKSAR Government |
47%[10] |
44% |
42% |
44+/-4% |
+2% |
|
Net value |
-4%[10] |
7%[10] |
12% |
7+/-8% |
-5% |
|
Perceived that the local news media had practiced self-censorship |
51% |
53% |
56% |
56+/-4% |
-- |
|
Perceived that the local news media had not practiced self-censorship |
30% |
33% |
30% |
29+/-4% |
-1% |
|
Net value |
22% |
20% |
26% |
27+/-7% |
+1% |
|
Perceived that the local news media had given full play to the freedom of speech |
62%[10] |
52%[10] |
47%[10] |
53+/-4% |
+5% |
|
Perceived that the local news media had not given full play to the freedom of speech |
28%[10] |
42%[10] |
44% |
39+/-4% |
-6%[10] [11] |
|
Net value |
34%[10] |
10%[10] |
3% |
14+/-8% |
+11%[10] |
|
Perceived that the local news media had misused/abused the freedom of press |
61%[10] |
56%[10] |
58% |
52+/-4% |
-6%[10] |
|
Perceived that the local news media had not misused/abused the freedom of press |
27%[10] |
33%[10] |
32% |
38+/-4% |
+6%[10] |
|
Net value |
34%[10] |
23%[10] |
27% |
14+/-8% |
-12%[10] |
|
Credibility rating of the local news media in general |
5.69 |
5.77 |
5.67 |
5.89+/-0.16 |
+0.22[10] [11] |
* “Overall response rate” was used before September 2017, thereafter, “effective response rate” was used.
[7] These questions only use sub-samples of the tracking surveys concerned, the sample size for each question also varies. The sub-sample sizes of this survey range from 546 to 593, and the increased sampling errors have already been reflected in the figures tabulated.
[8] All error figures in the table are calculated at 95% confidence level. “95% confidence level” means that if we were to repeat a certain survey 100 times, using the same questions each time but with different random samples, we would expect 95 times getting a figure within the error margins specified. Media can state “sampling error of rating not more than +/-0.16 mark, sampling error of percentages not more than +/-4% and sampling error of net values not more than +/-8% at 95% confidence level” when quoting the above figures. The error margin of previous survey can be found at the POP Site.
[9] Collapsed from a 5-point scale. The mean value is calculated by quantifying all individual responses into 1, 2, 3, 4, 5 marks according to their degree of positive level, where 1 is the lowest and 5 the highest, and then calculate the sample mean.
[10] Such changes have gone beyond the sampling errors at the 95% confidence level, meaning that they are statistically significant prima facie. However, whether numerical differences are statistically significant is not the same as whether they are practically useful or meaningful, and different weighting methods could have been applied in different surveys.
[11] Such changes have gone beyond the sampling errors at the 95% confidence level because of a change in the weighting method. If the previous weighting method was used, the changes would not have gone beyond the sampling errors.
Results of latest survey showed that 52% of the respondents were satisfied with the freedom of the press in Hong Kong while 30% were dissatisfied, net satisfaction at positive 22 percentage points. The mean value is 3.2, which is in between “half-half” and “quite satisfied”. 29% perceived the local news media to be responsible in their reporting, 39% regarded the local news media as irresponsible, giving a net value of negative 9 percentage points. The mean value is 2.8, meaning in between “half-half” and “quite irresponsible”. 64% thought the local news media had scruples when criticizing the Central Government, with a net value of positive 39 percentage points. 50% thought they had scruples when criticizing the HKSAR Government, net value at positive 7 percentage points. 56% of the respondents thought the local news media had practised self-censorship while 29% perceived the contrary, giving a net value of positive 27 percentage points. 53% believed the local news media had given full play to the freedom of speech, net value at positive 14 percentage points, but at the same time 52% said they had misused or abused the freedom of press, net value also at positive 14 percentage points. Besides, on a scale of 0-10, the latest credibility rating of the Hong Kong news media in general was 5.89 marks. The results of other questions such as people’s main source of news and their satisfaction on individual news media are shown below:
|
Date of survey |
10-12/4/17 |
3-4/10/17 |
2-4/4/18 |
20-22/8/18 |
Latest change |
|
Sample base[12] |
1,001 |
1,005 |
1,003 |
1,022 |
-- |
|
Response rate* |
72.3% |
59.5% |
57.9% |
53.0% |
-- |
|
Finding |
Finding |
Finding |
Finding |
Finding
|
-- |
|
People’s main source of news: Television |
75% |
79% |
74%[15] |
70+/-4% |
-3% |
|
People’s main source of news: Internet |
59% |
60% |
67%[15] |
63+/-4% |
-4% |
|
People’s main source of news: Newspaper |
42%[15] |
54%[15] |
48%[15] |
47+/-4% |
-1% |
|
People’s main source of news: Radio |
20%[15] |
32%[15] |
29% |
30+/-4% |
+1% |
|
People’s main source of news: Friends |
11% |
17%[15] |
19% |
18+/-3% |
-1% |
|
Perceived that television was the most trustworthy source |
42%[15] |
38% |
32%[15] |
33+/-4% |
-- |
|
Perceived that radio was the most trustworthy source |
14% |
17% |
17% |
17+/-3% |
-- |
|
Perceived that newspaper was the most trustworthy source |
17% |
15% |
14% |
16+/-3% |
+1% |
|
Perceived that internet was the most trustworthy source |
15% |
14% |
17% |
14+/-3% |
-4% |
|
Perceived that family member was the most trustworthy source |
2%[15] |
4% |
6% |
4+/-2% |
-2% |
|
Satisfaction rate of radio[14] |
56%[15] |
54% |
61%[15] |
56+/-4% |
-4% |
|
Dissatisfaction rate of radio[14] |
11% |
14% |
13% |
15+/-3% |
+2% |
|
Net satisfaction rate |
45%[15] |
40% |
48%[15] |
42+/-6% |
-6% |
|
Mean value[14] |
3.6 (Base=479) |
3.6 (Base=464) |
3.6 (Base=496) |
3.5+/-0.1 (Base=509) |
-0.1 |
|
Satisfaction rate of television[14] |
57%[15] |
53% |
52% |
54+/-4% |
+2% |
|
Dissatisfaction rate of television[14] |
18%[15] |
24%[15] |
24% |
24+/-4% |
-- |
|
Net satisfaction rate |
40%[15] |
29%[15] |
28% |
30+/-7% |
+2% |
|
Mean value[14] |
3.4 (Base=522) |
3.3 (Base=554) |
3.3 (Base=676) |
3.3+/-0.1 (Base=543) |
-- |
|
Satisfaction rate of internet[14] |
36% |
39% |
43% |
45+/-4% |
+2% |
|
Dissatisfaction rate of internet[14] |
22% |
20% |
21% |
21+/-3% |
-- |
|
Net satisfaction rate |
14% |
19% |
22% |
23+/-7% |
+2% |
|
Mean value[14] |
3.2 (Base=470) |
3.3 (Base=410) |
3.3 (Base=552) |
3.3+/-0.1 (Base=467) |
-- |
|
Satisfaction rate of newspapers[14] |
37% |
38% |
39% |
44+/-4% |
+5% |
|
Dissatisfaction rate of newspapers[14] |
29% |
27% |
30% |
24+/-4% |
-6%[15] |
|
Net satisfaction rate |
8% |
11% |
9% |
19+/-7% |
+10%[15] |
|
Mean value[14] |
3.1 (Base=491) |
3.1 (Base=490) |
3.0 (Base=607) |
3.2+/-0.1 (Base=502) |
+0.1[15] |
|
Satisfaction rate of magazines[14] |
10% |
13% |
19%[15] |
15+/-3% |
-4% |
|
Dissatisfaction rate of magazines[14] |
46%[15] |
41%[15] |
45% |
41+/-4% |
-4% |
|
Net satisfaction rate |
-36%[15] |
-28%[15] |
-26% |
-26+/-6% |
-- |
|
Mean value[14] |
2.4 (Base=386) |
2.5 (Base=430) |
2.5 (Base=482) |
2.5+/-0.1 (Base=426) |
-- |
|
Satisfaction rate of news media in general [14] |
47% |
48% |
50% |
49+/-4% |
-1% |
|
Dissatisfaction rate of news media in general [14] |
19% |
18% |
20% |
17+/-3% |
-4% |
|
Net satisfaction rate |
28% |
31% |
30% |
32+/-6% |
+3% |
|
Mean value[14] |
3.3 (Base=700) |
3.3 (Base=520) |
3.3 (Base=531) |
3.3+/-0.1 (Base=546) |
-- |
* “Overall response rate” was used before September 2017, thereafter, “effective response rate” was used.
[12] These questions only use sub-samples of the tracking surveys concerned, the sample size for each question also varies. The sub-sample sizes of this survey range from 544 to 586, and the increased sampling errors have already been reflected in the figures tabulated.
[13] All error figures in the table are calculated at 95% confidence level. “95% confidence level” means that if we were to repeat a certain survey 100 times, using the same questions each time but with different random samples, we would expect 95 times getting a figure within the error margins specified. Media can state “sampling error of percentages not more than +/-4% and that of net values not more than +/-7% at 95% confidence level” when quoting the above figures. The error margin of previous survey can be found at the POP Site.
[14] Collapsed from a 5-point scale. The mean value is calculated by quantifying all individual responses into 1, 2, 3, 4, 5 marks according to their degree of positive level, where 1 is the lowest and 5 the highest, and then calculate the sample mean.
[15] Such changes have gone beyond the sampling errors at the 95% confidence level, meaning that they are statistically significant prima facie. However, whether numerical differences are statistically significant is not the same as whether they are practically useful or meaningful, and different weighting methods could have been applied in different surveys.
Results of the survey also showed that 70% and 63% of the respondents claimed their main sources of news were television and internet respectively, while 33% thought the news reported by the former channel was the most trustworthy. Regarding people’s appraisal of various news channels, 56% of the respondents were satisfied with radio, whereas 54%, 45% and 44% were satisfied with television, internet and newspapers respectively. Net satisfactions of these channels were positive 42, 30, 23 and 19 percentage points, and their mean values were 3.5, 3.3, 3.3 and 3.2 respectively, meaning in between “half-half” and “quite satisfied”. Comparatively speaking, people’s satisfaction with magazines was lower, as the satisfaction rate was 15% only, and the net satisfaction stands at negative 26 percentage points, mean value at 2.5, which is in between “half-half” and “quite dissatisfied”. All in all, the latest satisfaction rate of the above news media in general was 49%, net satisfaction at positive 32 percentage points, and the mean value is 3.3, meaning between “half-half” and “quite satisfied”.
II. Public Sentiment Index
Background
The Public Sentiment Index (PSI) compiled by POP aims at quantifying Hong Kong people’s sentiments, in order to explain and predict the likelihood of collective behaviour. PSI comprises 2 components: one being Government Appraisal (GA) Score and the other being Society Appraisal (SA) Score. GA refers to people’s appraisal of society’s governance while SA refers to people’s appraisal of the social environment. Both GA and SA scores are compiled from a respective of 4 and 6 opinion survey figures. All PSI, GA and SA scores range between 0 to 200, with 100 meaning normal, the grading reference of the scores are shown below. For methodological detailed please refer to the HKU POP Site at http://hkupop.pori.hk.
POP started to pilot study the “Public Sentiment Index” in year 2010 in collaboration with NowTV. The first survey was conducted in June 2010, followed by a series of monthly tracking surveys in 2011. There were altogether 13 surveys, covered by 11 releases from March 2011 to January 2012. All results have been uploaded to the POP Site.
At the end of June 2012, before the 15th anniversary of the handover of Hong Kong, POP officially released a “PSI analysis” with figures dating back to 1992, spanning over 20 years. Moreover, the frequency of the study was set at twice a month. In October 2012, echoing the start of a new Legislative Council, POP decided to set the cut-off date of all PSI analyses at the Sunday proceeding every 15th and last day of month, whereas the release date was set at the first Thursday following the cut-off date. In July 2017, after the 20th anniversary of the handover, POP further streamlined the release date and mode of PSI analyses to become POP Site release only for the first analysis of each month, and POP Site plus press release for the second analysis of each month. At the same time, the second release was shifted to the first Tuesday of the following month, except under special circumstances.
Cut-off date of the PSI figures released by POP today is August 26, 2018, while that of the next round of release will be September 9, 2018. The tentative release date for the next release will be September 13, 2018 (Thursday).
Latest Figures of PSI
The PSI released by POP today shows that as of August 26, 2018, the latest Public Sentiment Index (PSI) is 105.3, down 1.5 from early August. As for the Government Appraisal (GA) and Society Appraisal (SA), the scores are 103.9 and 98.4. The former went up by 2.2, while the latter went down by 4.9. The chart of PSI, GA and SA are shown below:
|
|
|||
|
Latest figure |
Public Sentiment Index
|
Government Appraisal
|
Society Appraisal
|
Recent values of PSI, GA, SA and 10 fundamental figures are tabulated as follows:
|
Release date |
14/6/18 |
3/7/18 |
12/7/18 |
7/8/18 |
16/8/18 |
4/9/18 |
Latest change[17] |
|
Cut-off date |
10/6/18 |
24/6/18 |
8/7/18 |
29/7/18 |
12/8/18 |
26/8/18 |
-- |
|
Public Sentiment Index (PSI) |
107.5 |
107.6 |
108.9 |
107.5 |
106.8 |
105.3 |
-1.5 |
|
Government Appraisal (GA) |
104.1 |
103.3 |
105.4 |
102.9 |
101.8 |
103.9 |
+2.2 |
|
Rating of CE |
54.3 |
54.3 |
55.6 |
56.2 |
55.4 |
55.3 |
-0.1 |
|
Net approval rate of CE |
7% |
2% |
12% |
8% |
1% |
14% |
+12% |
|
Mean value of people’s satisfaction with SARG |
2.8 |
2.7 |
2.9 |
2.7 |
2.7[16] |
2.8 |
+0.1 |
|
Mean value of people’s trust in SARG |
3.1 |
3.1 |
3.0 |
3.0 |
3.0[16] |
3.0[16] |
-- |
|
Society Appraisal (SA) |
102.1 |
103.2 |
103.3 |
103.3 |
103.3 |
98.4 |
-4.9 |
|
People’s satisfaction with political condition |
2.2 |
2.3 |
2.3 |
2.3[16] |
2.3 |
2.2 |
-0.1 |
|
Weighting index of political condition |
0.31[16] |
0.31 |
0.31[16] |
0.31[16] |
0.31[16] |
0.31[16] |
-- |
|
People’s satisfaction with economic condition |
3.1 |
3.1 |
3.1 |
3.1[16] |
3.1 |
3.0 |
-0.1 |
|
Weighting index of economic condition |
0.34[16] |
0.34 |
0.34[16] |
0.34[16] |
0.34[16] |
0.34[16] |
-- |
|
People’s satisfaction with livelihood condition |
2.6 |
2.6 |
2.7 |
2.7[16] |
2.7 |
2.6 |
-0.1 |
|
Weighting index of livelihood condition |
0.36[16] |
0.35 |
0.35[16] |
0.35[16] |
0.35[16] |
0.35[16] |
-- |
[16] POP will adopt the latest published figures when there are no respective updates.
[17] Latest changes are based on the differences between the exact values of the two figures, but not the rounded figures shown in the table.
As for the meaning of the score values, please refer to the following:
|
Score value |
Percentile |
Score value |
Percentile |
|
140-200 |
Highest 1% |
0-60 |
Lowest 1% |
|
125 |
Highest 5% |
75 |
Lowest 5% |
|
120 |
Highest 10% |
80 |
Lowest 10% |
|
110 |
Highest 25% |
90 |
Lowest 25% |
|
100 being normal level, meaning half above half below |
|||
The latest PSI of 105.3 can be considered as among the best 36% across the past 20 years or so, while the GA and SA scores of 103.9 and 98.4 can be considered as among the best 40% and worst 46% respectively.
Commentary
Note: The following commentary was written by Senior Data Analyst of POP, Edward Tai.
Our latest survey shows that, among various types of news media, television and the internet remain to be people’s main sources of news. In terms of performance satisfaction, people are most satisfied with the performance of the radio, with net satisfaction standing at positive 42 percentage points. Television comes next with net satisfaction standing at positive 30 percentage points. Overall speaking, people’s net satisfaction with the performance of the news media in general now stands at positive 32 percentage points.
Compared to four months ago, people’s net satisfaction with press freedom has increased by 10 percentage points to positive 22 percentage points, but the change has not gone beyond sampling error. The majority of people thought the media have scruples when criticizing the Central Government, the net value is positive 39 percentage points. The percentage of those who thought the media have scruples when criticizing the HKSAR Government is also higher than those who thought otherwise, and the net value is positive 7 percentage points. Meanwhile, 56% believe Hong Kong’s news media have practiced self-censorship, another 29% think the opposite, giving a net value of positive 27 percentage points, which also is a record high since the survey question was first asked in 1997.
Besides, 29% and 39% consider the media responsible and irresponsible in their reporting respectively. More people think the media have given full play to press freedom, the net value has rebounded by 11 percentage points to positive 14 percentage points. At the same time, people also think that the media misused or abused press freedom, but its net value dropped by 12 percentage points and also stands at positive 14 percentage points. On a scale of 0-10, the latest general credibility rating of the news media stands at 5.89 marks.
As for the Public Sentiment Index (PSI), the latest PSI stands at 105.3, decreased by 1.5 points since early August. This time the two component scores of PSI go in opposite directions. Specifically, the Government Appraisal (GA) Score that reflects people’s appraisal of society’s governance goes up by 2.2 points to 103.9, whereas the Society Appraisal (SA) Score that reflects people’s appraisal of the social environment decreases by 4.9 points to 98.4. As for the reasons affecting the ups and downs of these figures, we leave it to our readers to form their own judgment using detailed records displayed in our “Opinion Daily”.
Future Release (Tentative)
Reference Materials on Survey on PSI Please refer to the HKU POP Site at http://hkupop.pori.hk.
|


