


HKU POP releases survey on the popularity of cross-strait political figures and the PSIBack
Press Release on August 7, 2018
| Detailed Findings (Rating of the Top Ten Political Figures in Mainland China and Taiwan) |
| Detailed Findings (Public Sentiment Index Feature Page) |
Special Announcements
1. From July 2017, apart from sampling landline numbers to conduct opinion surveys, the Public Opinion Programme (POP) of The University of Hong Kong has also added mobile numbers to the sampling frame. After three months of testing, in October 2017, POP formalized the use of mixed samples as its standard for regular opinion surveys using a landline and mobile sample ratio of 4 to 1. Starting from April 2018, POP further increased the proportion of mobile sample, which the landline and mobile sample ratio became 2 to 1. The figures released today by POP have already incorporated landline and mobile samples.
2. In September 2017, POP started to use “effective response rate” to report surveys’ contact information. In July 2018, POP further revised the calculation of effective response rate. Thus, the response rates before and after the change cannot be directly compared.
3. To facilitate academic study and rational discussion, POP has already released for public examination some time ago via the “HKU POP SITE” (http://hkupop.pori.hk) the raw data of regular rating surveys of current CE Carrie Lam, former CEs CH Tung, Donald Tsang and CY Leung, along with related demographics of respondents. Please follow normal academic standards when using or citing such data.
Abstract
POP conducted a two-stage survey on the rankings of the top 10 political figures in Mainland China and Taiwan in July by means of random telephone surveys conducted by real interviewers. The survey finds that compared to a year ago, the rankings of the top 10 cross-strait political figures have not changed much. On the awareness level, the top 10 cross-strait political figures are exactly the same as in the previous survey. The top 10 list continues to be a 7:3 split between Mainland and Taiwan figures. In terms of support rating, among the top 10 figures, 7 have risen while 3 have dropped. Among them, only the rating of Ma Ying-jeou has changed significantly, up by 3.7 marks, but that of Zhu Rongji has dropped to its record low since January 1998, while that of Tsai Ing-wen has dropped to its record low since she entered the list in September 2011. As for the relative rankings, Zhu Rongji continues to rank first. Xi Jinping and Wen Jiabao swap positions to rank second and third. Li Keqiang and Ma Ying-jeou both go up one position to rank 4th and 5th. Hu Jintao drops two positions to rank 6th. Jiang Zemin and Tsai Ing-wen swap positions to rank 7th and 8th, Li Peng and Chen Shui-bian remain unchanged at 9th and 10th. It should be noted that our list of “top 10 cross-strait political figures” only includes those best known to the Hong Kong public, ranked according to their support ratings. Other political figures may have very high or low support ratings, but they are excluded from the list because they are relatively less well-known. The maximum sampling error of all rating figures is +/-3.0 marks at 95% confidence level. The response rate of the rating survey is 51%.
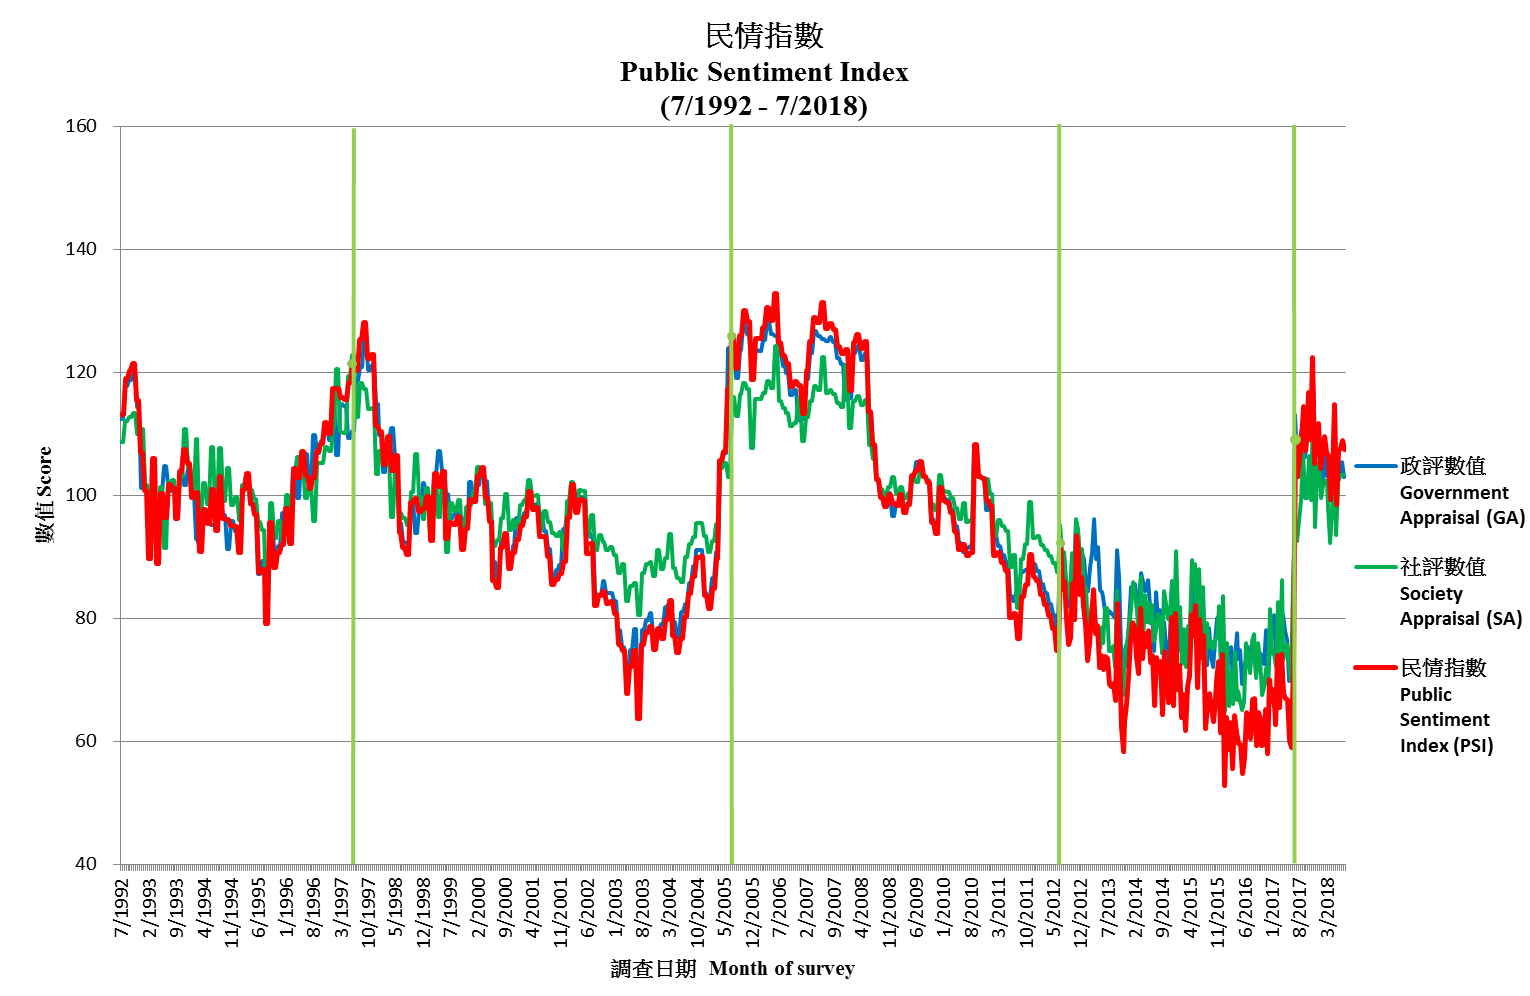
As for the Public Sentiment Index (PSI), the latest PSI stands at 107.5, decreased by 1.4 points since early July. This time the Government Appraisal (GA) Score of PSI that reflects people’s appraisal of society’s governance goes down by 2.5 points to 102.9, whereas the Society Appraisal (SA) Score that reflects people’s appraisal of the social environment is 103.3.
Points to note:
[1] The address of the “HKU POP SITE” is http://hkupop.pori.hk, journalists can check out the details of the survey there.
[2] The sample size of the first stage naming survey is 1,001 successful interviews, not 1,001 x 49.5% response rate, while the sample size of the second stage rating survey is other 500 successful interviews, not 500 x 50.8% response rate. In the past, many media made this mistake.
[3] “95% confidence level” means that if we were to repeat a certain survey 100 times, using the same questions each time but with different random samples, we would expect 95 times getting a figure within the error margins specified. When quoting these figures, journalists can state “sampling error of various ratings not more than +/-3.0 at 95% confidence level”.
[4] Because of sampling errors in conducting the survey(s) and the rounding procedures in processing the data, the figures cannot be too precise, and the totals may not be completely accurate. Therefore, when quoting percentages of the survey(s), journalists should refrain from reporting decimal places, but when quoting the rating figures, one decimal place can be used.
[5] The data of this survey is collected by means of random telephone interviews conducted by real interviewers, not by any interactive voice system (IVS). If a research organization uses “computerized random telephone survey” to camouflage its IVS operation, it should be considered unprofessional.
I. Popularity of Cross-Strait Political Figures
Latest Figures
From July 2017, POP enhanced the previous weighting method that has been used for quite a few years. Apart from age, gender and education, economic activity group is now also taken into account when adjusting data. The latest figures released today have been rim-weighted according to figures collected in the 2016 by-census regarding the gender-age distribution of the Hong Kong population and the 2017 educational attainment (highest level attended) distribution and economic activity status distribution obtained from the Census and Statistics Department. In the past, the mobile sample would be rim-weighted according to the basic Public Sentiment Index (PSI) figures collected in the landline sample. In July 2018, POP further refined the weighting method. The landline sample and the mobile sample would no longer be processed separately. The mobile would also no longer be adjusted using the basic PSI figures collected in the landline sample. The overall effect is that the importance of the mobile sample would be increased. Herewith the contact information for the latest survey:
|
Date of survey |
Sample size |
Effective response rate |
Maximum sampling error[6] |
|
3-5/7/2018 (Naming survey) |
1,001 |
49.5% |
+/-3% |
|
20-23/7/2018 (Rating survey) |
500 |
50.8% |
+/-3.0 |
[6] Errors are calculated at 95% confidence level using full sample size. “95% confidence level” means that if we were to repeat a certain survey 100 times, using the same questions each time but with different random samples, we would expect 95 times getting a figure within the error margins specified. Questions using only sub-samples would have bigger sampling error. Sampling errors of ratings are calculated according to the distribution of the scores collected.
The research design of our “Top 10 political figures of Mainland China and Taiwan” has been explained in detail under “Survey Method” in our corresponding web site. The top political figures listed in our latest survey were all those who obtained highest unprompted mentions in our first stage naming survey conducted on July 3-5. In that survey, respondents could name, unaided, up to 10 political figures whom they knew best. Xi Jinping, Tsai Ing-wen, Ma Ying-jeou, Li Keqiang and Hu Jintao were mentioned most frequently. Please refer to the relevant table for the rest of the list. The 12 most frequently mentioned political figures were then entered into the second stage of the survey conducted on July 20-23, during which respondents were asked to rate each political figure in turn using a 0-100 scale. 0 indicates absolutely no support, 100 indicates absolute support, and 50 means half-half. After calculation, the bottom 2 political figures in terms of recognition rate were dropped; the remaining 10 were then ranked according to their support ratings attained to become the top 10 political figures. For easy reference, the POP Site has already displayed the results of all naming surveys conducted since June 1997. Recent ratings of the top political figures in Mainland China and Taiwan are summarized as follows:
|
Date of survey |
12-18/8/16 |
27-30/3/17 |
17-20/7/17 |
20-23/7/18 |
Latest change |
|
|
Sample base |
529-676 |
537-702 |
732-816[7] |
500 |
-- |
|
|
Response rate* |
71.7% |
70.6% |
63.9% |
50.8% |
-- |
|
|
Latest finding |
Finding |
Finding |
Finding |
Finding & error[8] |
Recognition rate |
-- |
|
Zhu Rongji |
69.1{1} |
70.8{1} |
67.5{1}[9] |
66.8+/-2.3{1} |
81.9% |
-0.7 |
|
Xi Jinping |
59.7{3} |
65.5{2} |
57.6{3}[9] |
59.3+/-2.8{2} |
95.0% |
+1.7 |
|
Wen Jiabao |
62.8{2} |
63.8{3} |
58.7{2}[9] |
59.1+/-2.2{3} |
92.3% |
+0.4 |
|
Li Keqiang |
57.5{5} |
60.8{4} |
54.2{5}[9] |
57.3+/-2.5{4} |
88.6% |
+3.1 |
|
Ma Ying-jeou |
55.9{6} |
59.1{5} |
53.0{6}[9] |
56.7+/-1.7{5} |
90.5% |
+3.7[9] |
|
Hu Jintao |
57.7{4} |
58.8{6} |
54.9{4}[9] |
56.2+/-2.2{6} |
89.5% |
+1.4 |
|
Jiang Zemin |
49.7{8} |
48.6{7} |
44.6{8}[9] |
45.9+/-2.4{7} |
89.0% |
+1.3 |
|
Tsai Ing-wen |
52.9{7} |
48.1{8} |
45.4{7}[9] |
43.0+/-2.2{8} |
87.6% |
-2.4 |
|
Li Peng |
40.0{9} |
-- |
38.4{9} |
38.5+/-2.5{9} |
80.2% |
+0.1 |
|
Chen Shui-bian |
25.7{10} |
25.0{10} |
24.9{10} |
24.7+/-1.8{10} |
91.2% |
-0.2 |
|
Wang Qishan |
55.3 [10] |
-- |
-- |
56.2+/-3.0[10] |
68.3% |
-- |
|
Lee Teng-hui |
39.8 [10] |
42.4{9} |
39.1[9] [10] |
39.9+/-2.5[10] |
79.5% |
+0.8 |
|
Zhang Dejiang |
-- |
49.0[10] |
41.8[9] [10] |
-- |
-- |
-- |
|
Lien Chan |
-- |
50.6[10] |
-- |
-- |
-- |
-- |
* “Overall response rate” was used before September 2017, thereafter, “effective response rate” was used.
[7] The mobile sample was not included when survey results were released. The figures in the table above have been updated to reflect the results based on the combined landline and mobile sample. However, whether changes have gone beyond sampling errors is still determined based on the figures in the first release. After the update, the rating of Hu Jintao surpasses that of Li Keqiang and should be ranked the fourth in that survey.
[8] All error figures in the table are calculated at 95% confidence level. “95% confidence level” means that if we were to repeat a certain survey 100 times, using the same questions each time but with different random samples, we would expect 95 times getting a figure within the error margins specified. Media can state "sampling error of various ratings not more than +/-3.0 at 95% confidence level" when quoting the above figures. The error margin of previous survey can be found at the POP Site. {} Number in square brackets indicates rankings.
[9] Such changes have gone beyond the sampling errors at the 95% confidence level, meaning that they are statistically significant prima facie. However, whether numerical differences are statistically significant is not the same as whether they are practically useful or meaningful, and different weighting methods could have been applied in different surveys.
[10] Ratings with recognition rates not reaching top 10 in the rating stage of survey are not counted.
Latest survey revealed that, among the ten most well-known political figures in Mainland China and Taiwan, in terms of popularity rating, Zhu Rongji ranked first, attaining 66.8 marks. The 2nd and 3rd ranks went to Xi Jinping and Wen Jiabao with scores of 59.3 and 59.1 marks respectively. Li Keqiang, Ma Ying-jeou and Hu Jintao occupied the 4th to 6th ranks with 57.3, 56.7 and 56.2 marks correspondingly. The 7th to 10th ranks fell to Jiang Zemin, Tsai Ing-wen, Li Peng and Chen Shui-bian with respective scores of 45.9, 43.0, 38.5 and 24.7 marks. For this latest survey, Wang Qishan and Lee Teng-hui obtained support ratings of 56.2 and 39.9 marks respectively, but they were dropped due to their relatively low recognition rates. The mean score obtained by the top 5 political figures was 59.8 marks, while that for the top 10 was 50.7 marks. As for the overall ratings ranked according to results obtained over the past four surveys are tabulated as follows:
|
Date of survey |
12-18/8/16 |
27-30/3/17 |
17-20/7/17 |
20-23/7/18 |
No. of times on top 10 |
Average rating [11] |
Overall ranking [12] |
|
Zhu Rongji |
69.1 |
70.8 |
67.5 |
66.8 |
4 |
68.5 |
1 |
|
Wen Jiabao |
62.8 |
63.8 |
58.7 |
59.1 |
4 |
61.1 |
2 |
|
Xi Jinping |
59.7 |
65.5 |
57.6 |
59.3 |
4 |
60.5 |
3 |
|
Li Keqiang |
57.5 |
60.8 |
54.2 |
57.3 |
4 |
57.4 |
4 |
|
Hu Jintao |
57.7 |
58.8 |
54.9 |
56.2 |
4 |
56.9 |
5 |
|
Ma Ying-Jeou |
55.9 |
59.1 |
53.0 |
56.7 |
4 |
56.1 |
6 |
|
Tsai Ing-wen |
52.9 |
48.1 |
45.4 |
43.0 |
4 |
47.3 |
7 |
|
Jiang Zemin |
49.7 |
48.6 |
44.6 |
45.9 |
4 |
47.2 |
8 |
|
Chen Shui-bian |
25.7 |
25.0 |
24.9 |
24.7 |
4 |
25.0 |
9 |
|
Li Peng |
40.0 |
-- |
38.4 |
38.5 |
3 |
39.0 |
10 |
|
Lee Teng-hui |
-- |
42.4 |
-- |
-- |
1 |
42.4 |
11 |
[11] “Average rating” is the average of all ratings obtained by political figures over the past four surveys.
[12] “Overall ranking” is first determined by their number of times on top 10, and then their average ratings.
The overall rankings in the past four surveys showed that nine political figures have been on the list for four times. Zhu Rongji ranked first, achieving an average rating of 68.5 marks, Wen Jiabao and Xi Jinping ranked 2nd to 3rd, attaining 61.1 and 60.5 marks correspondingly, Li Keqiang, Hu Jintao, Ma Ying-Jeou, Tsai Ing-wen, Jiang Zemin and Chen Shui-bian ranked 4th to 9th with respective scores of 57.4, 56.9, 56.1, 47.3, 47.2 and 25.0 marks. Li Peng has been on the list three times and ranked the 10th with an average rating of 39.0 marks. Lee Teng-hui has been on the list once and ranked the 11th with an average rating of 42.4 marks.
II. Public Sentiment Index
Background
The Public Sentiment Index (PSI) compiled by POP aims at quantifying Hong Kong people’s sentiments, in order to explain and predict the likelihood of collective behaviour. PSI comprises 2 components: one being Government Appraisal (GA) Score and the other being Society Appraisal (SA) Score. GA refers to people’s appraisal of society’s governance while SA refers to people’s appraisal of the social environment. Both GA and SA scores are compiled from a respective of 4 and 6 opinion survey figures. All PSI, GA and SA scores range between 0 to 200, with 100 meaning normal, the grading reference of the scores are shown below. For methodological detailed please refer to the HKU POP Site at http://hkupop.pori.hk.
POP started to pilot study the “Public Sentiment Index” in year 2010 in collaboration with NowTV. The first survey was conducted in June 2010, followed by a series of monthly tracking surveys in 2011. There were altogether 13 surveys, covered by 11 releases from March 2011 to January 2012. All results have been uploaded to the POP Site.
At the end of June 2012, before the 15th anniversary of the handover of Hong Kong, POP officially released a “PSI analysis” with figures dating back to 1992, spanning over 20 years. Moreover, the frequency of the study was set at twice a month. In October 2012, echoing the start of a new Legislative Council, POP decided to set the cut-off date of all PSI analyses at the Sunday proceeding every 15th and last day of month, whereas the release date was set at the first Thursday following the cut-off date. In July 2017, after the 20th anniversary of the handover, POP further streamlined the release date and mode of PSI analyses to become POP Site release only for the first analysis of each month, and POP Site plus press release for the second analysis of each month. At the same time, the second release was shifted to the first Tuesday of the following month, except under special circumstances.
Cut-off date of the PSI figures released by POP today is July 29, 2018, while that of the next round of release will be August 12, 2018. The tentative release date for the next release will be August 16, 2018 (Thursday).
Latest Figures of PSI
The PSI released by POP today shows that as of July 29, 2018, the latest Public Sentiment Index (PSI) is 107.5, down 1.4 from early July. As for the Government Appraisal (GA) and Society Appraisal (SA), the scores are 102.9 and 103.3. The former went down by 2.5, while the latter has not been updated. The chart of PSI, GA and SA are shown below:
|
|
|||
|
Latest figure |
Public Sentiment Index
|
Government Appraisal
|
Society Appraisal
|
Recent values of PSI, GA, SA and 10 fundamental figures are tabulated as follows:
|
Release date |
17/5/18 |
5/6/18 |
14/6/18 |
3/7/18 |
12/7/18 |
7/8/18 |
Latest change[14] |
|
Cut-off date |
13/5/18 |
27/5/18 |
10/6/18 |
24/6/18 |
8/7/18 |
29/7/18 |
-- |
|
Public Sentiment Index (PSI) |
114.7 |
98.6 |
107.5 |
107.6 |
108.9 |
107.5 |
-1.4 |
|
Government Appraisal (GA) |
107.4 |
96.7 |
104.1 |
103.3 |
105.4 |
102.9 |
-2.5 |
|
Rating of CE |
57.8 |
52.7 |
54.3 |
54.3 |
55.6 |
56.2 |
+0.6 |
|
Net approval rate of CE |
13% |
-5% |
7% |
2% |
12% |
8% |
-3% |
|
Mean value of people’s satisfaction with SARG |
2.9 |
2.7 |
2.8 |
2.7 |
2.9 |
2.7 |
-0.2 |
|
Mean value of people’s trust in SARG |
3.1 |
2.8 |
3.1 |
3.1 |
3.0 |
3.0 |
-- |
|
Society Appraisal (SA) |
111.8 |
93.5 |
102.1 |
103.2 |
103.3 |
103.3 |
-- |
|
People’s satisfaction with political condition |
2.3 |
2.1 |
2.2 |
2.3 |
2.3 |
2.3[13] |
-- |
|
Weighting index of political condition |
0.31[13] |
0.31[13] |
0.31[13] |
0.31 |
0.31[13] |
0.31[13] |
-- |
|
People’s satisfaction with economic condition |
3.2 |
3.0 |
3.1 |
3.1 |
3.1 |
3.1[13] |
-- |
|
Weighting index of economic condition |
0.34[13] |
0.34[13] |
0.34[13] |
0.34 |
0.34[13] |
0.34[13] |
-- |
|
People’s satisfaction with livelihood condition |
2.8 |
2.5 |
2.6 |
2.6 |
2.7 |
2.7[13] |
-- |
|
Weighting index of livelihood condition |
0.36[13] |
0.36[13] |
0.36[13] |
0.35 |
0.35[13] |
0.35[13] |
-- |
[13] POP will adopt the latest published figures when there are no respective updates.
[14] Latest changes are based on the differences between the exact values of the two figures, but not the rounded figures shown in the table.
As for the meaning of the score values, please refer to the following:
|
Score value |
Percentile |
Score value |
Percentile |
|
140-200 |
Highest 1% |
0-60 |
Lowest 1% |
|
125 |
Highest 5% |
75 |
Lowest 5% |
|
120 |
Highest 10% |
80 |
Lowest 10% |
|
110 |
Highest 25% |
90 |
Lowest 25% |
|
100 being normal level, meaning half above half below |
|||
The latest PSI of 107.5 can be considered as among the best 31% across the past 20 years or so, while the GA and SA scores of 102.9 and 103.3 can be considered as among the best 42% and 41% respectively.
Commentary
Note: The following commentary was written by Research Manager of POP, Frank Lee.
Compared to a year ago, the rankings of the top 10 cross-strait political figures have not changed much. On the awareness level, the top 10 cross-strait political figures are exactly the same as in the previous survey. The top 10 list continues to be a 7:3 split between Mainland and Taiwan figures. In terms of support rating, among the top 10 figures, 7 have risen while 3 have dropped. Among them, only the rating of Ma Ying-jeou has changed significantly, up by 3.7 marks, but that of Zhu Rongji has dropped to its record low since January 1998, while that of Tsai Ing-wen has dropped to its record low since she entered the list in September 2011. As for the relative rankings, Zhu Rongji continues to rank first. Xi Jinping and Wen Jiabao swap positions to rank second and third. Li Keqiang and Ma Ying-jeou both go up one position to rank 4th and 5th. Hu Jintao drops two positions to rank 6th. Jiang Zemin and Tsai Ing-wen swap positions to rank 7th and 8th, Li Peng and Chen Shui-bian remain unchanged at 9th and 10th. It should be noted that our list of “top 10 cross-strait political figures” only includes those best known to the Hong Kong public, ranked according to their support ratings. Other political figures may have very high or low support ratings, but they are excluded from the list because they are relatively less well-known.
As for the Public Sentiment Index (PSI), the latest PSI stands at 107.5, decreased by 1.4 points since early July. This time the Government Appraisal (GA) Score of PSI that reflects people’s appraisal of society’s governance goes down by 2.5 points to 102.9, whereas the Society Appraisal (SA) Score that reflects people’s appraisal of the social environment is 103.3. As for the reasons affecting the ups and downs of these figures, we leave it to our readers to form their own judgment using detailed records displayed in our “Opinion Daily”.
Future Release (Tentative)
Reference Materials on Survey on PSI Please refer to the HKU POP Site at http://hkupop.pori.hk.
|


