


HKU POP releases society appraisal survey and the PSIBack
Press Release on July 3, 2018
| Detailed Findings (People's Level of Concern about Political, Economic and livelihood problems) |
| Detailed Findings (People's Satisfaction with Current Political, Economic and livelihood conditions) |
| Detailed Findings (Public Sentiment Index Feature Page) |
Special Announcements
1. From July 2017, apart from sampling landline numbers to conduct opinion surveys, the Public Opinion Programme (POP) of The University of Hong Kong has also added mobile numbers to the sampling frame. After three months of testing, in October 2017, POP formalized the use of mixed samples as its standard for regular opinion surveys using a landline and mobile sample ratio of 4 to 1. Starting from April 2018, POP further increased the proportion of mobile sample, which the landline and mobile sample ratio became 2 to 1. The figures released today by POP have already incorporated landline and mobile samples.
2. To facilitate academic study and rational discussion, POP has already released for public examination some time ago via the “HKU POP SITE” (http://hkupop.pori.hk) the raw data of regular rating surveys of current CE Carrie Lam, former CEs CH Tung, Donald Tsang and CY Leung, along with related demographics of respondents. Please follow normal academic standards when using or citing such data.
Abstract
POP interviewed 1,000 Hong Kong people between 14 and 21 June 2018 by means of a random telephone survey conducted by real interviewers. Our survey shows that using a one-in-three choices method, people are currently most concerned with livelihood issues, accounting for 63% of the total sample. Then, 18% and 16% express their concerns with economic and political issues respectively. In terms of absolute ratings, the ratings of people’s concerns with livelihood, economy and political problems are 7.45, 6.97 and 5.97 marks respectively.
As for the Public Sentiment Index (PSI), the latest PSI stands at 107.6, increased by 0.1 point since early June. This time the two component scores of PSI go in opposite directions. Specifically, the Government Appraisal (GA) Score that reflects people’s appraisal of society’s governance goes down by 0.8 point to 103.3, whereas the Society Appraisal (SA) Score that reflects people’s appraisal of the social environment increases by 1.1 points to 103.2. The maximum sampling error of all percentage figures is +/-3 percentage points at 95% confidence level, while the sampling error of rating figures need another calculation. The response rate of the survey is 60%.
Points to note:
[1] The address of the “HKU POP SITE” is http://hkupop.pori.hk, journalists can check out the details of the survey there.
[2] The sample size of this survey is 1,000 successful interviews, not 1,000 x 59.6% response rate. In the past, many media made this mistake.
[3] The maximum sampling error of percentages is +/-3 percentage points at 95% confidence level, while the sampling error of rating figure and net value needs another calculation. “95% confidence level” means that if we were to repeat a certain survey 100 times, using the same questions each time but with different random samples, we would expect 95 times getting a figure within the error margins specified. When quoting these figures, journalists can state “sampling error of rating not more than +/-0.16 and sampling error of percentages not more than +/-3% at 95% confidence level”.
[4] Because of sampling errors in conducting the survey(s) and the rounding procedures in processing the data, the figures cannot be too precise, and the totals may not be completely accurate. Therefore, when quoting percentages of the survey(s), journalists should refrain from reporting decimal places, but when quoting the rating figures, one decimal place can be used.
[5] The data of this survey is collected by means of random telephone interviews conducted by real interviewers, not by any interactive voice system (IVS). If a research organization uses “computerized random telephone survey” to camouflage its IVS operation, it should be considered unprofessional.
I. Society Appraisal Survey
Latest Figures
From July 2017, POP enhanced the previous weighting method that has been used for quite a few years. Apart from age, gender and education, economic activity group is now also taken into account when adjusting data. The latest figures released today have been rim-weighted according to figures collected in the 2016 by-census regarding the gender-age distribution of the Hong Kong population and the 2017 educational attainment (highest level attended) distribution and economic activity status distribution obtained from the Census and Statistics Department. The mobile sample has also been rim-weighted according to the basic Public Sentiment Index (PSI) figures collected in the landline sample. Herewith the contact information for the latest survey:
|
Date of survey |
Effective sample size |
Effective response rate |
Maximum sampling error
|
|
14-21/6/2018 |
1,000 |
59.6% |
+/-3% |
[6] Errors are calculated at 95% confidence level using full sample size. “95% confidence level” means that if we were to repeat a certain survey 100 times, using the same questions each time but with different random samples, we would expect 95 times getting a figure within the error margins specified.
Recent figures of people’s concerns of society’s conditions are summarized as follows:
|
Date of survey |
27-30/6/16 |
19-22/12/16 |
19-22/6/17 |
18-19/12/17 |
14-21/6/18 |
Latest change |
|
Sample base |
1,006 |
1,009 |
1,007 |
1,013 |
1,000 |
-- |
|
Response rate* |
70.1% |
70.9% |
71.2% |
64.9% |
59.6% |
-- |
|
Finding |
Finding |
Finding |
Finding |
Finding |
Finding & error [7] |
-- |
|
Most concerned with livelihood problems |
58% |
63%[8] |
68%[8] |
65% |
63+/-3% |
-2% |
|
Most concerned with political problems |
19% |
18% |
17% |
16% |
18+/-2% |
+2% |
|
Most concerned with economic problems |
19% |
17% |
13%[8] |
16%[8] |
16+/-2% |
-- |
|
Rating on concern for livelihood problems |
7.44 |
7.33 |
7.45[8] |
7.37 |
7.45+/-0.12 |
+0.08 |
|
Rating on concern for economic problems |
6.92 |
6.84 |
6.88 |
6.81 |
6.97+/-0.13 |
+0.16[8] |
|
Rating on concern for political problems |
5.98 |
6.06 |
5.85[8] |
5.97 |
5.97+/-0.16 |
-- |
* “Overall response rate” was used before September 2017. Thereafter, “effective response rate” was used.
[7] All error figures in the table are calculated at 95% confidence level. “95% confidence level” means that if we were to repeat a certain survey 100 times, using the same questions each time but with different random samples, we would expect 95 times getting a figure within the error margins specified. Media can state “sampling error of all percentages not more than +/-3% and that of ratings not more than +/-0.16, at 95% confidence level” when quoting the above figures. The error margin of previous survey can be found at the POP Site.
[8] Such changes have gone beyond the sampling errors at the 95% confidence level, meaning that they are statistically significant prima facie. However, whether numerical differences are statistically significant is not the same as whether they are practically useful or meaningful, and different weighting methods could have been applied in different surveys.
Latest survey showed that 63% of the respondents were most concerned with livelihood problems, 18% and 16% respectively attached their greatest concerns to economic problems and political problems respectively. Using a scale of 0-10 marks, the ratings of people’s concern over livelihood, economic and political problems were 7.45, 6.97 and 5.97 marks correspondingly.
As for people’s satisfaction of society’s conditions, the figures have already been released in the previous press release. People’s latest satisfaction rates with the current economic, livelihood and political conditions were 45%, 28% and 22% respectively, while their net satisfaction rates in these conditions were positive 13, negative 23 and negative 37 percentage points. The mean scores of the economic, livelihood and political conditions were 3.1, 2.6 and 2.3, meaning between “half-half” and “quite dissatisfied” in general. Please refer to the POP Site for figures in previous surveys.
Opinion Daily
In January 2007, POP opened a feature page called “Opinion Daily” at the “POP Site”, to record significant events and selected polling figures on a day-to-day basis, in order to let readers judge by themselves the reasons for the ups and downs of different opinion figures. In July 2007, POP collaborated with Wisers Information Limited whereby Wisers supplies to POP each day starting from July 24, a record of significant events of that day, according to the research method designed by POP. These daily entries would be uploaded to “Opinion Daily” as soon as they are verified by POP.
For the polling items covered in this press release, the previous survey was conducted from December 18 to 19, 2017 while this survey was conducted from June 14 to 21, 2018. During this period, herewith the significant events selected from counting newspaper headlines and commentaries on a daily basis and covered by at least 25% of the local newspaper articles. Readers can make their own judgment if these significant events have any impacts to different polling figures.
|
16/6/18 |
Media continues to report on problems about the construction of the Shatin to Central Link. |
|
14/6/18 |
The Legislative Council passes the third reading of the Guangzhou-Shenzhen-Hong Kong Express Rail Link (Co-location) Bill. |
|
11/6/18 |
Edward Leung Tin-kei is sentenced for 6 years for rioting in Mong Kok during the Lunar New Year in 2016. |
|
6/6/18 |
Dishonest practices were exposed in the coupling of steel bars in Hung Hom Station at the Shatin to Central Link. |
|
14/5/18 |
President Xi Jinping supports Hong Kong becoming an international center for innovative science and technology. |
|
11/5/18 |
First meeting of the Hong Kong-Sichuan Co-operation Conference is held in Chengdu. |
|
5/5/18 |
Ted Hui is arrested for snatching an Executive Officer’s phone. |
|
28/4/18 |
The Central Government’s Liaison Office holds “Public Open Day” for the first time. |
|
26/4/18 |
The Task Force on Land Supply commences public consultation. |
|
21/4/18 |
Qiao Xiaoyang says Hong Kong independence is unconstitutional. |
|
15/4/18 |
Hong Kong holds the National Security Education Day for the first time. |
|
31/3/18 |
Media reports on the remarks made by Benny Tai Yiu-ting, Associate Professor of the Faculty of Law of the University of Hong Kong at a Taiwan seminar that Hong Kong could consider becoming an independent state. |
|
27/3/18 |
MTR fare will increase by 3.14% in June. |
|
23/3/18 |
Government announces that eligible citizens can collect $4,000 through the Caring and Sharing Scheme. |
|
12/3/18 |
The pro-democracy camp and the pro-establishment camp win two seats each in the Legislative Council by-election. |
|
28/2/18 |
Financial Secretary Paul Chan delivers the first Budget of the current-term government. |
II. Public Sentiment Index
Background
The Public Sentiment Index (PSI) compiled by POP aims at quantifying Hong Kong people’s sentiments, in order to explain and predict the likelihood of collective behaviour. PSI comprises 2 components: one being Government Appraisal (GA) Score and the other being Society Appraisal (SA) Score. GA refers to people’s appraisal of society’s governance while SA refers to people’s appraisal of the social environment. Both GA and SA scores are compiled from a respective of 4 and 6 opinion survey figures. All PSI, GA and SA scores range between 0 to 200, with 100 meaning normal, the grading reference of the scores are shown below. For methodological detailed please refer to the HKU POP Site at http://hkupop.pori.hk.
POP started to pilot study the “Public Sentiment Index” in year 2010 in collaboration with NowTV. The first survey was conducted in June 2010, followed by a series of monthly tracking surveys in 2011. There were altogether 13 surveys, covered by 11 releases from March 2011 to January 2012. All results have been uploaded to the POP Site.
At the end of June 2012, before the 15th anniversary of the handover of Hong Kong, POP officially released a “PSI analysis” with figures dating back to 1992, spanning over 20 years. Moreover, the frequency of the study was set at twice a month. In October 2012, echoing the start of a new Legislative Council, POP decided to set the cut-off date of all PSI analyses at the Sunday proceeding every 15th and last day of month, whereas the release date was set at the first Thursday following the cut-off date. In July 2017, after the 20th anniversary of the handover, POP further streamlined the release date and mode of PSI analyses to become POP Site release only for the first analysis of each month, and POP Site plus press release for the second analysis of each month. At the same time, the second release was shifted to the first Tuesday of the following month, except under special circumstances.
Cut-off date of the PSI figures released by POP today is June 24, 2018, while that of the next round of release will be July 8, 2018. The tentative release date for the next release will be July 12, 2018 (Thursday).
Latest Figures of PSI
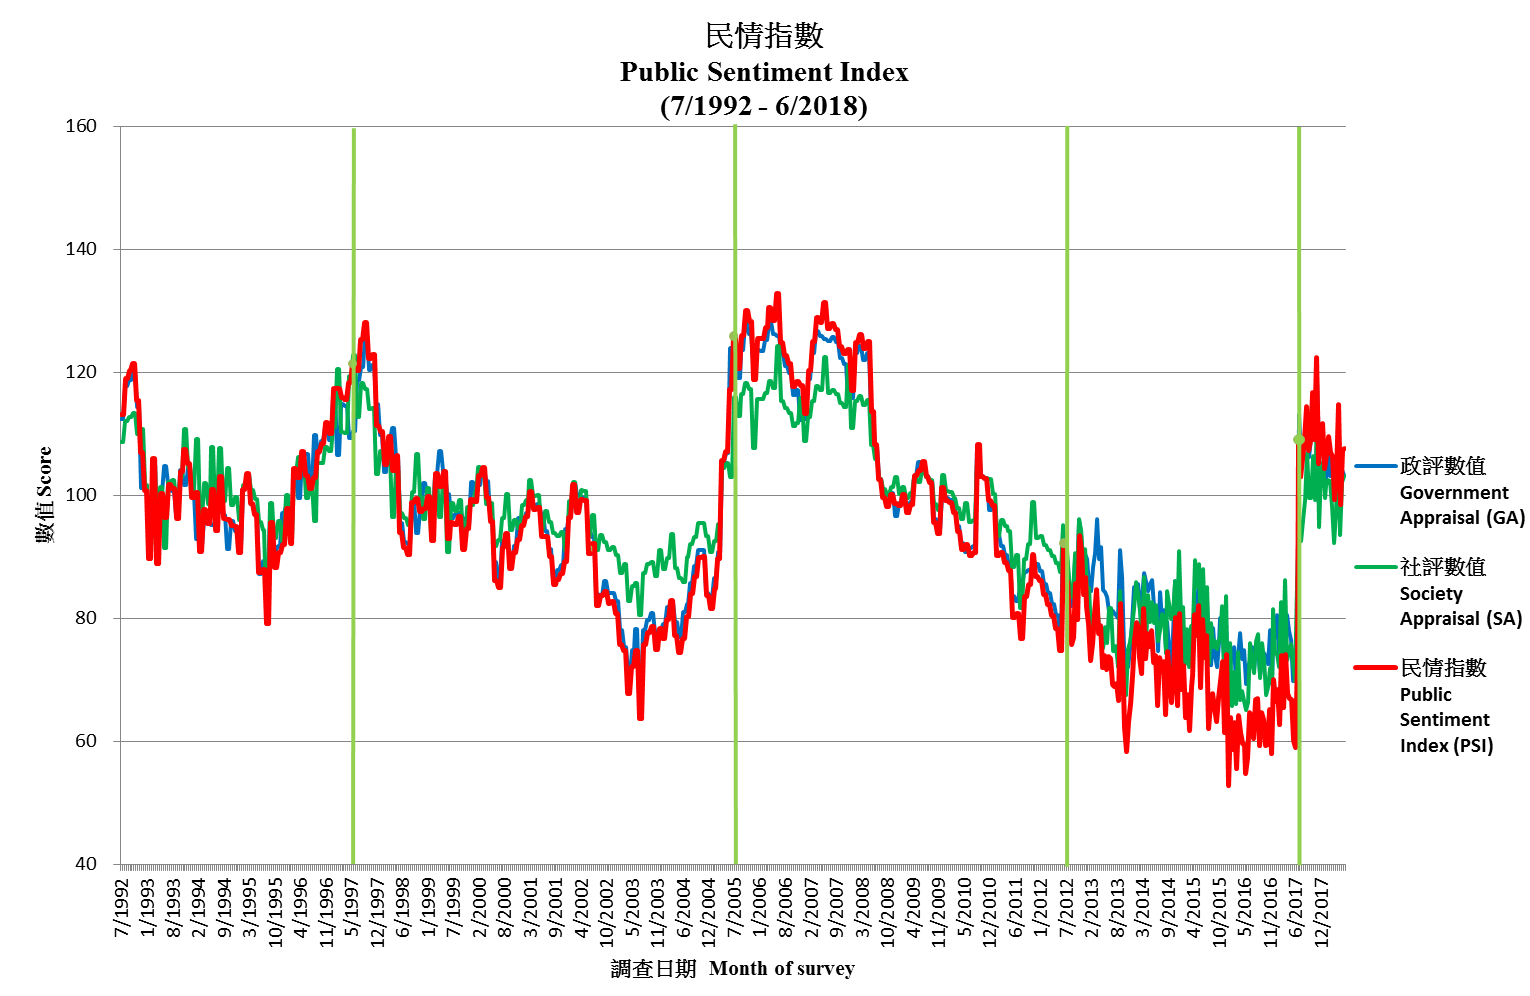
The PSI released by POP today shows that as of June 24, 2018, the latest Public Sentiment Index (PSI) is 107.6, up 0.1 from early June. As for the Government Appraisal (GA) and Society Appraisal (SA), the scores are 103.3 and 103.2, down 0.8 and up 1.1 respectively. The chart of PSI, GA and SA are shown below:
|
|
|||
|
Latest figure |
Public Sentiment Index
|
Government Appraisal
|
Society Appraisal
|
Recent values of PSI, GA, SA and 10 fundamental figures are tabulated as follows:
|
Release date |
12/4/18 |
2/5/18 |
17/5/18 |
5/6/18 |
14/6/18 |
3/7/18 |
Latest change[10] |
|
Cut-off date |
8/4/18 |
29/4/18 |
13/5/18 |
27/5/18 |
10/6/18 |
24/6/18 |
-- |
|
Public Sentiment Index (PSI) |
99.3 |
103.6 |
114.7 |
98.6 |
107.5 |
107.6 |
+0.1 |
|
Government Appraisal (GA) |
99.3 |
102.0 |
107.4 |
96.7 |
104.1 |
103.3 |
-0.8 |
|
Rating of CE |
55.6 |
53.9 |
57.8 |
52.7 |
54.3 |
54.3 |
-0.1 |
|
Net approval rate of CE |
-2% |
4% |
13% |
-5% |
7% |
2% |
-5% |
|
Mean value of people’s satisfaction with SARG |
2.6 |
2.8 |
2.9 |
2.7 |
2.8 |
2.7 |
-- |
|
Mean value of people’s trust in SARG |
2.9 |
3.0 |
3.1 |
2.8 |
3.1 |
3.1 |
-- |
|
Society Appraisal (SA) |
92.3 |
97.4 |
111.8 |
93.5 |
102.1 |
103.2 |
+1.1 |
|
People’s satisfaction with political condition |
2.1 |
2.1 |
2.3 |
2.1 |
2.2 |
2.3 |
+0.1 |
|
Weighting index of political condition |
0.31[9] |
0.31[9] |
0.31[9] |
0.31[9] |
0.31[9] |
0.31 |
-- |
|
People’s satisfaction with economic condition |
2.9 |
2.9 |
3.2 |
3.0 |
3.1 |
3.1 |
-- |
|
Weighting index of economic condition |
0.34[9] |
0.34[9] |
0.34[9] |
0.34[9] |
0.34[9] |
0.34 |
-- |
|
People’s satisfaction with livelihood condition |
2.4 |
2.6 |
2.8 |
2.5 |
2.6 |
2.6 |
-- |
|
Weighting index of livelihood condition |
0.36[9] |
0.36[9] |
0.36[9] |
0.36[9] |
0.36[9] |
0.35 |
-- |
[9] POP will adopt the latest published weighting index figures when there are no respective updates.
[10] Latest changes are based on the differences between the exact values of the two figures, but not the rounded figures shown in the table.
As for the meaning of the score values, please refer to the following:
|
Score value |
Percentile |
Score value |
Percentile |
|
140-200 |
Highest 1% |
0-60 |
Lowest 1% |
|
125 |
Highest 5% |
75 |
Lowest 5% |
|
120 |
Highest 10% |
80 |
Lowest 10% |
|
110 |
Highest 25% |
90 |
Lowest 25% |
|
100 being normal level, meaning half above half below |
|||
The latest PSI of 107.6 can be considered as among the best 31% across the past 20 years or so, while the GA and SA scores of 103.3 and 103.2 can be considered as among the best 41% and 42% respectively.
Commentary
Note: The following commentary was written by Senior Data Analyst of POP, Edward Tai.
According to our latest survey, using a one-in-three choices method, people are currently most concerned with livelihood issues, accounting for 63% of the total sample. Then, 18% and 16% express their concerns with economic and political issues respectively. In terms of absolute ratings, the ratings of people’s concerns with livelihood, economy and political problems are 7.45, 6.97 and 5.97 marks respectively.
As for the Public Sentiment Index (PSI), the latest PSI stands at 107.6, increased by 0.1 point since early June. This time the two component scores of PSI go in opposite directions. Specifically, the Government Appraisal (GA) Score that reflects people’s appraisal of society’s governance goes down by 0.8 point to 103.3, whereas the Society Appraisal (SA) Score that reflects people’s appraisal of the social environment increases by 1.1 points to 103.2. As for the reasons affecting the ups and downs of these figures, we leave it to our readers to form their own judgment using detailed records displayed in our “Opinion Daily”.
Future Release (Tentative)
Reference Materials on Survey on PSI Please refer to the HKU POP Site at http://hkupop.pori.hk.
|


