


HKU POP releases the first Budget follow-up survey and the PSIBack
Press Release on March 6, 2018
| Detailed Findings (Budget Feature Page) |
| Detailed Findings (Public Sentiment Index Feature Page) |
Special Announcements
1. From July 2017, apart from sampling landline numbers to conduct opinion surveys, the Public Opinion Programme (POP) of The University of Hong Kong has also added mobile numbers to the sampling frame. After three months of testing, in October 2017, POP formalized the use of mixed samples as its standard for regular opinion surveys. The figures released today by POP have already incorporated landline and mobile samples, while “effective response rate” is continued to be used to describe the survey’s contact information. As for the weighting method, a two-step protocol is used. First, both the landline and mobile samples have been rim-weighted according to figures collected in the 2016 By-census regarding the gender-age distribution of the Hong Kong population and the 2017 educational attainment (highest level attended) distribution and economic activity status distribution obtained from the Census and Statistics Department. After that, the mobile sample was rim-weighted according to the basic Public Sentiment Index (PSI) figures collected in the landline sample, and then mixed together to produce the final results. This weighting method has proved to be feasible after three months of testing, but POP will continue to review and enhance it, and keep the public informed.
2. To facilitate academic study and rational discussion, POP has already released for public examination some time ago via the “HKU POP SITE” (http://hkupop.pori.hk) the raw data of regular rating surveys of current CE Carrie Lam, former CEs CH Tung, Donald Tsang and CY Leung, along with related demographics of respondents. Please follow normal academic standards when using or citing such data.
Abstract
People’s instant reaction to this year’s Budget in the first night can be considered negative, with a net satisfaction of negative 14 percentage points. As for the rating of the Budget, this year’s instant survey gave a rating of 48.2 marks. After one to two days of media coverage, the reaction gets more negative significantly. The latest satisfaction rate stands at 31%, dissatisfaction rate 54%, net satisfaction rate goes down remarkably by 9 percentage points to negative 23 percentage points, while its satisfaction rating also plunges by 5.4 marks to 42.8. This shows people’s response has become more negative after digesting some information and discussions on the Budget. How people’s reaction will change after knowing even more about the Budget remains to be revealed by our second follow-up survey to be conducted weeks later. In terms of macroscopic appraisal of Hong Kong’s economic condition, 56% consider Hong Kong’s tax system fair, but 67% consider the distribution of wealth unreasonable. Meanwhile, 32% are satisfied with the government’s strategy in monetary arrangement, 50% are dissatisfied, giving a net satisfaction rate of negative 18 percentage points, representing a significant drop of 18 percentage points compared to last year. Our data show that people’s net satisfaction rate and satisfaction rating of the Budget, as well as the net satisfaction rate of the government’s strategy in monetary arrangement, have all reached their record lows since 2011. The maximum sampling error of all percentages is +/-4 percentage points at 95% confidence level, while the sampling error of rating figures is +/-2.4, and net values need another calculation. The response rate of the survey is 63%.
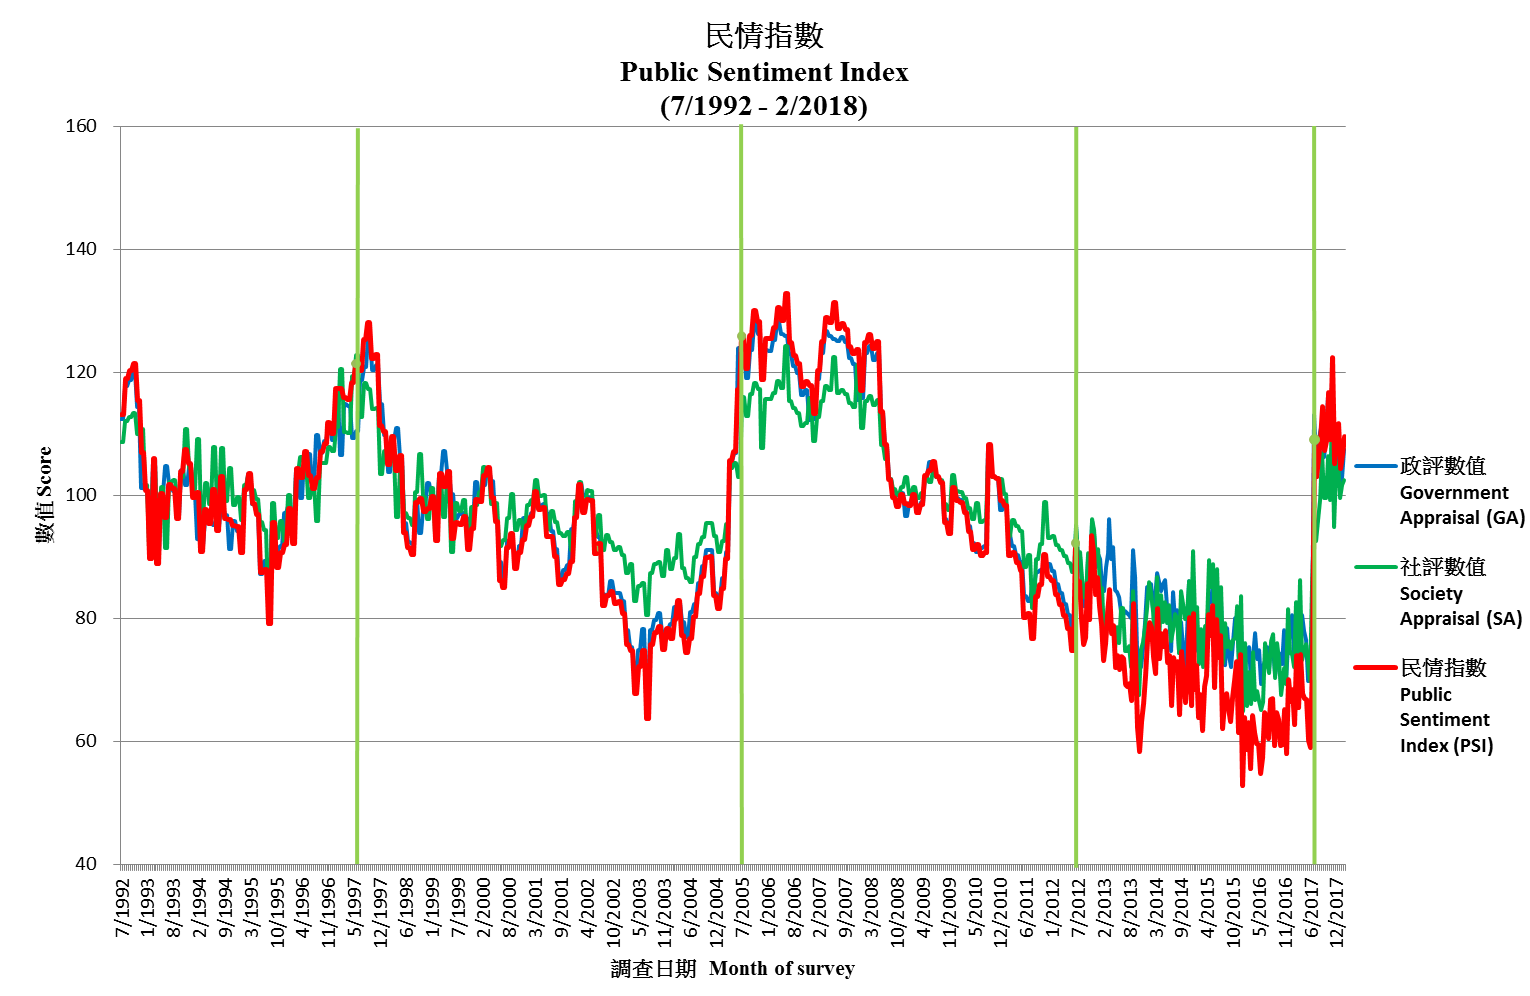
As for the Public Sentiment Index (PSI), the latest PSI registered at the end of February before the Budget was announced stands at 109.6, up by 3.1 points since mid-February. This time both component scores of PSI increased. Specifically, the Government Appraisal (GA) Score that reflects people’s appraisal of society’s governance goes up by 4.6 points to 107.6, and the Society Appraisal (SA) Score that reflects people’s appraisal of the social environment increased by 0.9 points to 102.5.
Points to note:
[1] The address of the “HKU POP SITE” is http://hkupop.pori.hk, journalists can check out the details of the survey there.
[2] The sample size of this survey is 507 successful interviews, not 507 x 62.6% response rate. In the past, many media made this mistake.
[3] The maximum sampling error of all percentages is +/-4 percentage points at 95% confidence level, while the sampling error of rating figure and net value needs another calculation. “95% confidence level” means that if we were to repeat a certain survey 100 times, using the same questions each time but with different random samples, we would expect 95 times getting a figure within the error margins specified. When quoting these figures, journalists can state “sampling error of rating not more than +/-2.4, sampling error of percentages not more than +/-4%, and sampling error of net values not more than +/-8% at 95% confidence level”.
[4] Because of sampling errors in conducting the survey(s) and the rounding procedures in processing the data, the figures cannot be too precise, and the totals may not be completely accurate. Therefore, when quoting percentages of the survey(s), journalists should refrain from reporting decimal places, but when quoting the rating figures, one decimal place can be used.
[5] The data of this survey is collected by means of random telephone interviews conducted by real interviewers, not by any interactive voice system (IVS). If a research organization uses “computerized random telephone survey” to camouflage its IVS operation, it should be considered unprofessional.
I. First Budget Follow-up Survey
Background
Since 1992, POP has been conducting Policy Address instant surveys every year. From 1998 onwards, we expanded our instant surveys to cover the Budget Speeches. In free and democratic societies, instant surveys are indispensable sources of free information. Combined with appropriate follow-up surveys, and in parallel to expert analyses, they give a multi-dimensional picture of opinion development. They are an important part of a society’s interactive development. Starting 2008, we split up previous years’ instant survey into two surveys. As of now, in our first survey, we measure people’s overall appraisal of the Budget, their rating of the Budget, and FS’s popularity. A day later, we start our second survey to study any change in people’s satisfaction of the Budget, their satisfaction with the government’s strategy in monetary arrangement, and other relevant issues.
Latest Figures
POP today releases the findings of the first Budget follow-up survey. From July 2017, POP enhanced the previous weighting method that has been used for quite a few years. Apart from age, gender and education, economic activity group is now also taken into account when adjusting data. The latest figures released today have been rim-weighted according to figures collected in the 2016 By-census regarding the gender-age distribution of the Hong Kong population and the 2017 educational attainment (highest level attended) distribution and economic activity status distribution obtained from the Census and Statistics Department. The mobile sample has also been rim-weighted according to the basic Public Sentiment Index (PSI) figures collected in the landline sample. Herewith the contact information for the latest survey:
|
Date of survey |
Effective sample size |
Effective response rate |
Maximum sampling error
|
|
1-2/3/2018 |
507 |
62.6% |
+/-4% |
[6] Errors are calculated at 95% confidence level using full sample size. “95% confidence level” means that if we were to repeat a certain survey 100 times, using the same questions each time but with different random samples, we would expect 95 times getting a figure within the error margins specified.
Results of the first Budget follow-up surveys of 2016 to 2018 together with their corresponding instant polls are tabulated below:
|
2018 |
|||
|
Instant survey |
First follow-up survey[7] |
Latest change |
|
|
Date of survey |
28/2/2018 |
1-2/3/2018 |
-- |
|
Sample base |
614[8] |
507 |
-- |
|
Effective response rate |
67.5% |
62.6% |
-- |
|
Appraisal of Budget: Satisfaction rate[9] |
26% |
31+/-4% |
+5%[10] |
|
Appraisal of Budget: Dissatisfaction rate[9] |
41% |
54+/-4% |
+13%[10] |
|
Net satisfaction rate |
-14% |
-23+/-8% |
-9%[10] |
|
Mean value[9] |
2.7 (Base=523) |
2.5+/-0.1 (Base=492) |
-0.2[10] |
|
Satisfaction rating of Budget (0 to 100 marks) |
48.2 |
42.8+/-2.4 |
-5.4[10] |
|
2017 |
|||
|
Instant survey |
First follow-up survey |
Latest change |
|
|
Date of survey |
22/2/2017 |
23-24/2/2017 |
-- |
|
Sample base |
502[11] |
506 |
-- |
|
Overall response rate |
64.4% |
70.4% |
-- |
|
Appraisal of Budget: Satisfaction rate[9] |
33% |
26% |
-7%[10] |
|
Appraisal of Budget: Dissatisfaction rate[9] |
18% |
27% |
+9%[10] |
|
Net satisfaction rate |
15% |
0% |
-15%[10] |
|
Mean value[9] |
3.2 (Base=412) |
2.9 (Base=407) |
-0.3[10] |
|
Satisfaction rating of Budget (0 to 100 marks) |
55.7 |
52.6 |
-3.1[10] |
|
2016 |
|||
|
Instant survey |
First follow-up survey |
Latest change |
|
|
Date of survey |
24/2/2016 |
25-26/2/2016 |
-- |
|
Sample base |
528[12] |
514 |
-- |
|
Overall response rate |
63.6% |
68.6% |
-- |
|
Appraisal of Budget: Satisfaction rate[9] |
36% |
41% |
+5%[10] |
|
Appraisal of Budget: Dissatisfaction rate[9] |
20% |
17% |
-3% |
|
Net satisfaction rate |
17% |
24% |
+7%[10] |
|
Mean value[9] |
3.2 (Base=432) |
3.3 (Base=449) |
+0.1 |
|
Satisfaction rating of Budget (0 to 100 marks) |
57.2 |
60.5 |
+3.3[10] |
[7] All error figures in the table are calculated at 95% confidence level. “95% confidence level” means that if we were to repeat a certain survey 100 times, using the same questions each time but with different random samples, we would expect 95 times getting a figure within the error margins specified. Questions using only sub-samples would have bigger sample error. Sampling errors of ratings are calculated according to the distribution of the scores collected.
[8] Excluding respondents who said they had not heard of the Budget, or were not clear about the Budget content. The sub-sample size was 551.
[9] Collapsed from a 5-point scale. The mean value is calculated by quantifying all individual responses into 1, 2, 3, 4, 5 marks according to their degree of positive level, where 1 is the lowest and 5 the highest, and then calculate the sample mean.
[10] Such changes have gone beyond the sampling errors at the 95% confidence level, meaning that they are statistically significant prima facie. However, whether numerical differences are statistically significant is not the same as whether they are practically useful or meaningful, and different weighting methods could have been applied in different surveys.
[11] Excluding respondents who said they had not heard of the Budget, or were not clear about the Budget content. The sub-sample size was 502.
[12] Excluding respondents who said they had not heard of the Budget, or were not clear about the Budget content. The sub-sample size was 500.
Our first Budget follow-up survey reveals that 31% of the respondents were satisfied with the Budget and 54% were dissatisfied, thus net satisfaction stands at negative 23 percentage points. The mean score is 2.5, which is between “half-half” and “quite dissatisfied” in general. The average rating registered for the Budget was 42.8 marks.
With respect to people’s satisfaction with the government’s strategy in monetary arrangement and other relevant issues, the figures are summarized below:
|
Date of survey |
Sample base |
Finding and error[13] |
|||||||
|
Satisfied with the government’s strategy in monetary
arrangement
|
Dissatisfied with the government’s strategy in monetary
arrangement
|
Net satisfaction rate |
Mean value[14] |
Perceived the tax system in Hong Kong to be fair [15] |
Perceived the tax system in Hong Kong to be unfair
|
Perceived the distribution of wealth in Hong Kong to be
reasonable
|
Perceived the distribution of wealth in Hong Kong to be
unreasonable
|
||
|
1-2/3/18 |
507 |
32+/-4% |
50[16]+/-4% |
-18[16]+/-8% |
2.6[16]+/-0.1
|
56+/-4% |
32+/-4% |
26[16]+/-4% |
67+/-4% |
|
23-24/2/17 |
506 |
32[16]+/-4% |
32+/-4% |
0+/-7% |
2.9+/-0.1
|
58+/-4% |
28+/-4% |
20[16]+/-4% |
68[16]+/-4% |
|
25-26/2/16 |
514 |
37+/-4% |
34+/-4% |
3+/-7% |
2.9+/-0.1
|
58+/-4% |
28+/-4% |
30+/-4% |
57+/-4% |
|
26-27/2/15 |
520 |
36[16]+/-4% |
31[16]+/-4% |
5[16]+/-7% |
3.0[16]+/-0.1
|
62[16]+/-4% |
28[16]+/-4% |
30[16]+/-4% |
56[16]+/-4% |
|
27-28/2/14 |
516 |
27+/-4% |
38+/-4% |
-11+/-7% |
2.8+/-0.1
|
52+/-4% |
35+/-4% |
24[16]+/-4% |
64+/-4% |
|
28/2-1/3/13 |
520 |
30+/-4% |
42+/-4% |
-12+/-7% |
2.8+/-0.1
|
51[16]+/-4% |
37[16]+/-4% |
19+/-3% |
67+/-4% |
|
2-3/2/12 |
504 |
33[16]+/-4% |
43[16]+/-4% |
-10[16]+/-8% |
2.8[16]+/-0.1
|
56[16]+/-4% |
32[16]+/-4% |
20+/-4% |
70+/-4% |
|
24-25/2/11 |
515 |
21[16]+/-4% |
52[16]+/-4% |
-31[16]+/-7% |
2.5[16]+/-0.1
|
51[16]+/-4% |
39[16]+/-4% |
16[16]+/-3% |
74[16]+/-4% |
|
25-27/2/10 |
517 |
34+/-4% |
30+/-4% |
4[16]+/-7% |
3.0+/-0.1
|
60+/-4% |
31+/-4% |
27+/-4% |
62+/-4% |
|
26/2/09 |
525 |
30[16]+/-4% |
34[16]+/-4% |
-4[16]+/-7% |
2.9[16]+/-0.1
|
64+/-4% |
29[16]+/-4% |
29[16]+/-4% |
62[16]+/-4% |
|
28/2/08 |
525 |
60[16]+/-4% |
12+/-3% |
48[16]+/-6% |
3.6+/-0.1
|
67+/-4% |
22[16]+/-4% |
42[16]+/-4% |
45[16]+/-4% |
|
28/2/07 |
1,018 |
49[16]+/-3% |
10[16]+/-2% |
39[16]+/-4% |
3.5[16]+/-0.1
|
63[16]+/-3% |
28[16]+/-3% |
34+/-3% |
52+/-3% |
|
22/2/06 |
1,026 |
36[16]+/-3% |
15+/-2% |
21[16]+/-4% |
3.3+/-0.1
|
55[16]+/-3% |
34[16]+/-3% |
32+/-3% |
55[16]+/-3% |
|
16/3/05 |
1,041 |
29[16]+/-3% |
15[16]+/-2% |
14[16]+/-4% |
3.2[16]+/-0.1
|
59+/-3% |
27[16]+/-3% |
29[16]+/-3% |
51[16]+/-3% |
|
10/3/04 |
1,023 |
18[16]+/-2% |
29[16]+/-3% |
-12[16]+/-4% |
2.8[16]+/-0.1
|
58[16]+/-3% |
31+/-3% |
22+/-3% |
62+/-3% |
|
5/3/03 |
1,047 |
12[16]+/-2% |
45[16]+/-3% |
-33[16]+/-4% |
2.4[16]+/-0.1
|
51[16]+/-3% |
33[16]+/-3% |
19[16]+/-2% |
60[16]+/-3% |
|
6/3/02 |
1,041 |
26[16]+/-3% |
21[16]+/-3% |
5[16]+/-4% |
3.0[16]+/-0.1
|
55+/-3% |
29+/-3% |
25+/-3% |
52+/-3% |
|
7-8/3/01 |
502 |
45[16]+/-5% |
14[16]+/-3% |
32[16]+/-7% |
3.4[16]+/-0.1
|
-- |
-- |
-- |
-- |
|
8/3/00 |
856 |
60[16]+/-4% |
9[16]+/-2% |
51[16]+/-5% |
3.6[16]+/-0.1
|
-- |
-- |
-- |
-- |
|
18/2/98 |
804 |
42+/-3% |
13+/-2% |
29+/-5% |
3.4+/-0.1
|
-- |
-- |
-- |
-- |
[13] All error figures in the table are calculated at 95% confidence level. “95% confidence level” means that if we were to repeat a certain survey 100 times, using the same questions each time but with different random samples, we would expect 95 times getting a figure within the error margins specified. Questions using only sub-samples would have bigger sample error. Sampling errors of ratings are calculated according to the distribution of the scores collected.
[14] Collapsed from a 5-point scale. The mean value is calculated by quantifying all individual responses into 1, 2, 3, 4, 5 marks according to their degree of positive level, where 1 is the lowest and 5 the highest, and then calculate the sample mean.
[15] Collapsed from a 4-point scale.
[16] Such changes have gone beyond the sampling errors at the 95% confidence level, meaning that they are statistically significant prima facie. However, whether numerical differences are statistically significant is not the same as whether they are practically useful or meaningful, and different weighting methods could have been applied in different surveys.
Latest results revealed that 32% were satisfied with the government’s strategy in monetary arrangement, whereas 50% were dissatisfied, thus net satisfaction stands at negative 18 percentage points, and mean value at 2.6, which is between “half-half” and “quite dissatisfied” in general. With respect to Hong Kong’s tax system, 56% considered it fair, whilst 32% thought it was unfair. Last of all, 26% perceived the distribution of wealth in Hong Kong reasonable, as contrast to 67% who regarded it unreasonable.
II. Public Sentiment Index
Background
The Public Sentiment Index (PSI) compiled by POP aims at quantifying Hong Kong people’s sentiments, in order to explain and predict the likelihood of collective behaviour. PSI comprises 2 components: one being Government Appraisal (GA) Score and the other being Society Appraisal (SA) Score. GA refers to people’s appraisal of society’s governance while SA refers to people’s appraisal of the social environment. Both GA and SA scores are compiled from a respective of 4 and 6 opinion survey figures. All PSI, GA and SA scores range between 0 to 200, with 100 meaning normal, the grading reference of the scores are shown below. For methodological detailed please refer to the HKU POP Site at http://hkupop.pori.hk.
POP started to pilot study the “Public Sentiment Index” in year 2010 in collaboration with NowTV. The first survey was conducted in June 2010, followed by a series of monthly tracking surveys in 2011. There were altogether 13 surveys, covered by 11 releases from March 2011 to January 2012. All results have been uploaded to the POP Site.
At the end of June 2012, before the 15th anniversary of the handover of Hong Kong, POP officially released a “PSI analysis” with figures dating back to 1992, spanning over 20 years. Moreover, the frequency of the study was set at twice a month. In October 2012, echoing the start of a new Legislative Council, POP decided to set the cut-off date of all PSI analyses at the Sunday proceeding every 15th and last day of month, whereas the release date was set at the first Thursday following the cut-off date. In July 2017, after the 20th anniversary of the handover, POP further streamlined the release date and mode of PSI analyses to become POP Site release only for the first analysis of each month, and POP Site plus press release for the second analysis of each month. At the same time, the second release was shifted to the first Tuesday of the following month, except under special circumstances.
Cut-off date of the PSI figures released by POP today is February 25, 2018, while that of the next round of release will be March 11, 2018. The tentative release date for the next release will be March 15, 2018 (Thursday).
Latest Figures of PSI
The PSI released by POP today shows that as of February 25, 2018, the latest Public Sentiment Index (PSI) is 109.6, up 3.1 from mid-February. As for the Government Appraisal (GA) and Society Appraisal (SA), the scores are 107.6 and 102.5, up 4.6 and 0.9 respectively. The chart of PSI, GA and SA are shown below:
|
|
|||
|
Latest figure |
Public Sentiment Index
|
Government Appraisal
|
Society Appraisal
|
Recent values of PSI, GA, SA and 10 fundamental figures are tabulated as follows:
|
Release date |
14/12/17 |
2/1/18 |
18/1/18 |
6/2/18 |
15/2/18 |
6/3/18 |
Latest change [18] |
|
Cut-off date |
10/12/17 |
31/12/17 |
14/1/18 |
28/1/18 |
11/2/18 |
25/2/18 |
-- |
|
Public Sentiment Index (PSI) |
105.2 |
111.3 |
111.6 |
104.4 |
106.6 |
109.6 |
+3.1 |
|
Government Appraisal (GA) |
107.2 |
109.0 |
108.2 |
101.3 |
103.0 |
107.6 |
+4.6 |
|
Rating of CE |
55.7 |
58.3 |
58.7 |
54.4 |
53.6 |
55.7 |
+2.1 |
|
Net approval rate of CE |
12% |
12% |
15% |
4% |
4% |
7% |
+3% |
|
Mean value of people’s satisfaction with SARG |
2.9 |
3.0 |
2.9 |
2.7 |
2.9 |
2.9 |
+0.1 |
|
Mean value of people’s trust in SARG |
3.1 |
3.1 |
3.1 |
2.9 |
3.0 |
3.1 |
+0.1 |
|
Society Appraisal (SA) |
94.9 |
104.1 |
105.4 |
99.5 |
101.6 |
102.5 |
+0.9 |
|
People’s satisfaction with political condition |
2.3 |
2.1 |
2.2 |
2.1 |
2.1 |
2.2 |
+0.1 |
|
Weighting index of political condition |
0.30[17] |
0.31 |
0.31[17] |
0.31[17] |
0.31[17] |
0.31[17] |
-- |
|
People’s satisfaction with economic condition |
2.8 |
3.1 |
3.1 |
3.1 |
3.1 |
3.1 |
-- |
|
Weighting index of economic condition |
0.34[17] |
0.34 |
0.34[17] |
0.34[17] |
0.34[17] |
0.34[17] |
-- |
|
People’s satisfaction with livelihood condition |
2.5 |
2.7 |
2.7 |
2.6 |
2.7 |
2.6 |
-- |
|
Weighting index of livelihood condition |
0.36[17] |
0.36 |
0.36[17] |
0.36[17] |
0.36[17] |
0.36[17] |
-- |
[17] POP will adopt the latest published weighting index figures when there are no respective updates.
[18] Latest changes are based on the differences between the exact values of the two figures, but not the rounded figures shown in the table.
As for the meaning of the score values, please refer to the following:
|
Score value |
Percentile |
Score value |
Percentile |
|
140-200 |
Highest 1% |
0-60 |
Lowest 1% |
|
125 |
Highest 5% |
75 |
Lowest 5% |
|
120 |
Highest 10% |
80 |
Lowest 10% |
|
110 |
Highest 25% |
90 |
Lowest 25% |
|
100 being normal level, meaning half above half below |
|||
The latest PSI of 109.6 can be considered as among the best 26% across the past 25 years, while the GA and SA scores of 107.6 and 102.5 can be considered as among the best 31% and 43% respectively.
Commentary
Note: The following commentary was written by Senior Data Analyst of POP, Edward Tai.
Our survey showed that people’s instant reaction to this year’s Budget in the first night can be considered negative, with a net satisfaction of negative 14 percentage points. As for the rating of the Budget, this year’s instant survey gave a rating of 48.2 marks. After one to two days of media coverage, the reaction gets more negative significantly. The latest satisfaction rate stands at 31%, dissatisfaction rate 54%, net satisfaction rate goes down remarkably by 9 percentage points to negative 23 percentage points, while its satisfaction rating also plunges by 5.4 marks to 42.8. This shows people’s response has become more negative after digesting some information and discussions on the Budget. How people’s reaction will change after knowing even more about the Budget remains to be revealed by our second follow-up survey to be conducted weeks later. In terms of macroscopic appraisal of Hong Kong’s economic condition, 56% consider Hong Kong’s tax system fair, but 67% consider the distribution of wealth unreasonable. Meanwhile, 32% are satisfied with the government’s strategy in monetary arrangement, 50% are dissatisfied, giving a net satisfaction rate of negative 18 percentage points, representing a significant drop of 18 percentage points compared to last year. Our data show that people’s net satisfaction rate and satisfaction rating of the Budget, as well as the net satisfaction rate of the government’s strategy in monetary arrangement, have all reached their record lows since 2011.
As for the Public Sentiment Index (PSI), the latest PSI registered at the end of February before the Budget was announced stands at 109.6, up by 3.1 points since mid-February. This time both component scores of PSI increased. Specifically, the Government Appraisal (GA) Score that reflects people’s appraisal of society’s governance goes up by 4.6 points to 107.6, and the Society Appraisal (SA) Score that reflects people’s appraisal of the social environment increased by 0.9 points to 102.5. As for the reasons affecting the ups and downs of various indicators and figures, we leave it to our readers to form their own judgment using detailed records displayed in our “Opinion Daily”.
Future Release (Tentative)
Reference Materials on Survey on PSI Please refer to the HKU POP Site at http://hkupop.pori.hk.
|


