


HKU POP releases the latest social indicators and the PSIBack
Press Release on February 6, 2018
| Detailed Findings (Social Indicators) | (Freedom Indicators) | (Rule of law indicators) |
| Detailed Findings (Public Sentiment Index Feature Page) |
Special Announcements
1. From July 2017, apart from sampling landline numbers to conduct opinion surveys, the Public Opinion Programme (POP) of The University of Hong Kong has also added mobile numbers to the sampling frame. After three months of testing, in October 2017, POP formalized the use of mixed samples as its standard for regular opinion surveys. The figures released today by POP have already incorporated landline and mobile samples, while “effective response rate” is continued to be used to describe the survey’s contact information. As for the weighting method, a two-step protocol is used. First, both the landline and mobile samples have been rim-weighted according to figures collected in the 2016 By-census regarding the gender-age distribution of the Hong Kong population and the 2017 educational attainment (highest level attended) distribution and economic activity status distribution obtained from the Census and Statistics Department. After that, the mobile sample was rim-weighted according to the basic Public Sentiment Index (PSI) figures collected in the landline sample, and then mixed together to produce the final results. This weighting method has proved to be feasible after three months of testing, but POP will continue to review and enhance it, and keep the public informed.
2. To facilitate academic study and rational discussion, POP has already released for public examination some time ago via the “HKU POP SITE” (http://hkupop.pori.hk) the raw data of regular rating surveys of current CE Carrie Lam, former CEs CH Tung, Donald Tsang and CY Leung, along with related demographics of respondents. Please follow normal academic standards when using or citing such data.
Abstract
POP interviewed 1,035 Hong Kong people between 15 and 18 January by means of a random telephone survey conducted by real interviewers. Our latest survey shows that compared to half a year ago, which is the time when the new cabinet of Carrie Lam took office, nearly all social indicators have dropped, reflecting that people appraised the Hong Kong society more negatively than 6 months before. To be specific, the ratings of 5 core social indicators (namely, the “prosperity”, “freedom”, “stability”, “rule of law” and “democracy”) have all gone down, particularly so for the “rule of law” and “democracy”, while that of “democracy” has even dropped to its record low since 2004. As for the non-core social indicators, among the 7 indicators, degrees of “civilization”, “corruption-free practices”, “social welfare sufficiency”, “equality” and “fairness” have dropped significantly. As for the 10 freedom sub-indicators, 8 of which including the freedoms of “enter or leave Hong Kong”, “artistic and literary creation”, “academic research”, “speech”, “association”, “strike”, “publication” and “press” have registered significant decreases, while the rating of “freedom to strike” has also hit its record low since 2000. In the area of rule of law, ratings of both “fairness of the judicial system” and “impartiality of the courts” have registered significant decreases while the latest support rating of Chief Justice Geoffrey Ma has also gone down by 3.1 marks to 65.1. The maximum sampling error of rating figures of various indicators is +/-0.20 mark at 95% confidence level; while that of Geoffrey Ma is no greater than +/-1.8 marks. The response rate of the survey is 64%.
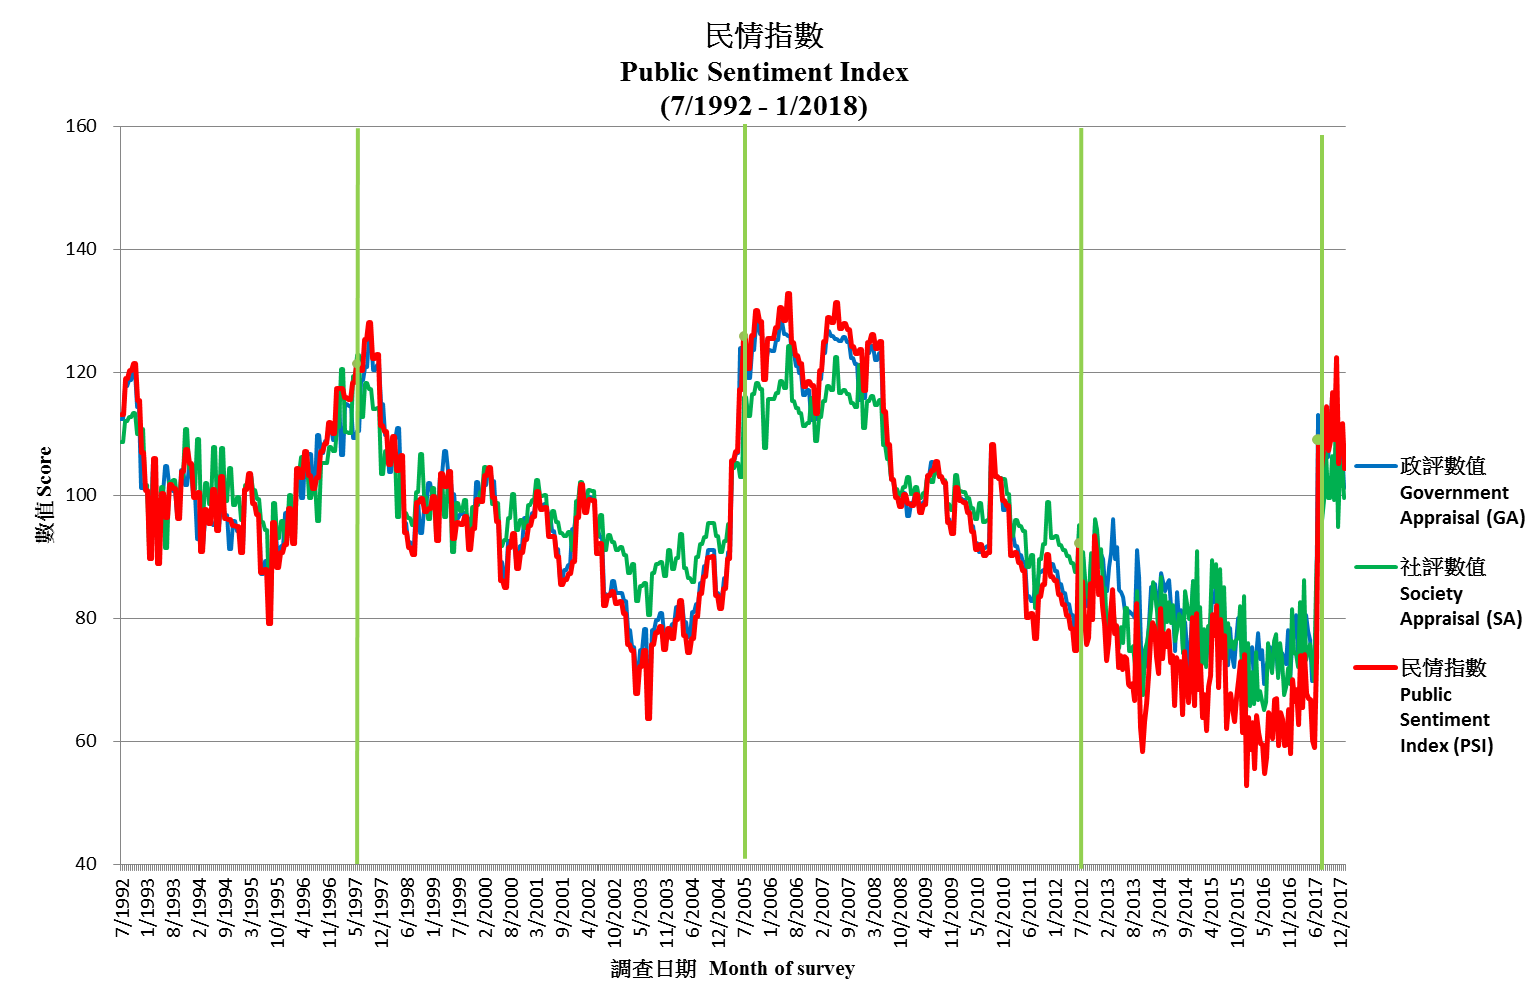
As for the Public Sentiment Index (PSI), the latest PSI stands at 104.4, dropped 7.2 points since mid-January. This time both component scores of PSI decreased. Specifically, the Government Appraisal (GA) Score that reflects people’s appraisal of society’s governance goes down by 7.0 points to 101.3, and the Society Appraisal (SA) Score that reflects people’s appraisal of the social environment decreased by 5.9 points to 99.5.
Points to note:
[1] The address of the “HKU POP SITE” is http://hkupop.pori.hk, journalists can check out the details of the survey there.
[2] The sample size of this survey is 1,035 successful interviews, not 1,035 x 63.6% response rate. In the past, many media made this mistake.
[3] “95% confidence level” means that if we were to repeat a certain survey 100 times, using the same questions each time but with different random samples, we would expect 95 times getting a figure within the error margins specified. When quoting these figures, journalists can state “sampling error of rating of various indicators not more than +/-0.20 while that of Geoffrey Ma not more than +/-1.8 at 95% confidence level”.
[4] Because of sampling errors in conducting the survey(s) and the rounding procedures in processing the data, the figures cannot be too precise, and the totals may not be completely accurate. Therefore, when quoting percentages of the survey(s), journalists should refrain from reporting decimal places, but when quoting the rating figures, one decimal place can be used.
[5] The data of this survey is collected by means of random telephone interviews conducted by real interviewers, not by any interactive voice system (IVS). If a research organization uses “computerized random telephone survey” to camouflage its IVS operation, it should be considered unprofessional.
I. Social Indicators
Latest Figures
POP today releases the latest social indicators, include 5 core indicators, 7 non-core indicators, 10 freedom sub-indicators, 2 rule of law sub-indicators, and the rating of Chief Justice Geoffrey Ma Tao-li. From July 2017, POP enhanced the previous weighting method that has been used for quite a few years. Apart from age, gender and education, economic activity group is now also taken into account when adjusting data. The latest figures released today have been rim-weighted according to figures collected in the 2016 By-census regarding the gender-age distribution of the Hong Kong population and the 2017 educational attainment (highest level attended) distribution and economic activity status distribution obtained from the Census and Statistics Department. The mobile sample has also been rim-weighted according to the basic Public Sentiment Index (PSI) figures collected in the landline sample. Herewith the contact information for the latest survey:
|
Date of survey |
Effective sample size |
Effective response rate |
Maximum sampling error of ratings[6] |
|
15-18/1/2018 |
1,035 |
63.6% |
+/-1.8 |
[6] Errors are calculated at 95% confidence level using full sample size. “95% confidence level” means that if we were to repeat a certain survey 100 times, using the same questions each time but with different random samples, we would expect 95 times getting a figure within the error margins specified.
Herewith the latest figures of the 5 core social indicators:
|
Date of survey |
15-18/2/16 |
18-21/7/16 |
6-9/2/17 |
10-13/7/17 |
15-18/1/18 |
Latest change
|
|
Sample size[7] |
1,026 |
1,013 |
1,029 |
804 |
1,035 |
-- |
|
Response rate* |
66.8% |
73.6% |
70.5% |
72.0% |
63.6% |
-- |
|
Finding |
Finding |
Finding |
Finding |
Finding |
Finding & error[8] |
-- |
|
Degree of prosperity |
6.45[9] |
6.46 |
6.63[9] |
7.03[9] |
6.93+/-0.15 |
-0.10 |
|
Degree of freedom |
6.91 |
6.62[9] |
6.90[9] |
7.07[9] |
6.72+/-0.18 |
-0.35[9] |
|
Degree of stability |
5.84[9] |
6.31[9] |
6.41 |
6.83[9] |
6.65+/-0.16 |
-0.18[9] |
|
Compliance with the rule of law |
6.45 |
6.19[9] |
6.63[9] |
7.08[9] |
6.29+/-0.17 |
-0.79[9] |
|
Degree of democracy |
5.89 |
5.86 |
6.02 |
6.39[9] |
5.74+/-0.20 |
-0.65[9] |
* “Overall response rate” was used before September 2017, thereafter, “effective response rate” was used.
[7] These questions only use sub-samples of the tracking surveys concerned. The sub-sample sizes of this survey range from 586 to 640, and the increased sampling errors have already been reflected in the figures tabulated.
[8] All error figures in the table are calculated at 95% confidence level. “95% confidence level” means that if we were to repeat a certain survey 100 times, using the same questions each time but with different random samples, we would expect 95 times getting a figure within the error margins specified. Media can state “sampling error of various ratings not more than +/-0.20 at 95% confidence level” when quoting the above figures.
[9] Such changes have gone beyond the sampling errors at the 95% confidence level, meaning that they are statistically significant prima facie. However, whether numerical differences are statistically significant is not the same as whether they are practically useful or meaningful, and different weighting methods could have been applied in different surveys.
Herewith the latest figures of the 7 non-core social indicators:
|
Date of survey |
15-18/2/16 |
18-21/7/16 |
6-9/2/17 |
10-13/7/17 |
15-18/1/18 |
Latest change |
|
Sample size[10] |
1,026 |
1,013 |
1,029 |
804 |
1,035 |
-- |
|
Response rate* |
66.8% |
73.6% |
70.5% |
72.0% |
63.6% |
-- |
|
Finding |
Finding |
Finding |
Finding |
Finding |
Finding & error[11] |
-- |
|
Degree of public order |
6.79[12] |
7.09[12] |
7.16 |
7.50[12] |
7.52+/-0.13 |
+0.02 |
|
Degree of civilization |
6.74[12] |
6.71 |
6.83 |
7.24[12] |
6.83+/-0.16 |
-0.41[12] |
|
Degree of efficiency |
6.54 |
6.32[12] |
6.58[12] |
6.86[12] |
6.72+/-0.16 |
-0.14 |
|
Degree of corruption-free practices |
6.36 |
5.95[12] |
6.17[12] |
6.78[12] |
6.30+/-0.18 |
-0.48[12] |
|
Degree of social welfare sufficiency |
6.20[12] |
6.24 |
6.21 |
6.61[12] |
6.12+/-0.17 |
-0.49[12] |
|
Degree of equality |
5.90 |
5.66[12] |
6.09[12] |
6.39[12] |
5.87+/-0.18 |
-0.52[12] |
|
Degree of fairness |
5.53 |
5.58 |
5.66 |
6.02[12] |
5.47+/-0.19 |
-0.55[12] |
* “Overall response rate” was used before September 2017, thereafter, “effective response rate” was used.
[10] These questions only use sub-samples of the tracking surveys concerned. The sub-sample sizes of this survey range from 587 to 649, and the increased sampling errors have already been reflected in the figures tabulated.
[11] All error figures in the table are calculated at 95% confidence level. “95% confidence level” means that if we were to repeat a certain survey 100 times, using the same questions each time but with different random samples, we would expect 95 times getting a figure within the error margins specified. Media can state “sampling error of various ratings not more than +/-0.19 at 95% confidence level” when quoting the above figures.
[12] Such changes have gone beyond the sampling errors at the 95% confidence level, meaning that they are statistically significant prima facie. However, whether numerical differences are statistically significant is not the same as whether they are practically useful or meaningful, and different weighting methods could have been applied in different surveys.
Herewith the latest figures of the 10 freedom sub-indicators:
|
Date of survey |
15-18/2/16 |
18-21/7/16 |
6-9/2/17 |
10-13/7/17 |
15-18/1/18 |
Latest change |
|
Sample size[13] |
1,026 |
1,013 |
1,029 |
804 |
1,035 |
-- |
|
Response rate* |
66.8% |
73.6% |
70.5% |
72.0% |
63.6% |
-- |
|
Finding |
Finding |
Finding |
Finding |
Finding |
Finding & error[13] |
-- |
|
Degree of freedom
|
6.91 |
6.62[15] |
6.90[15] |
7.07[15] |
6.72+/-0.18 |
-0.35[15] |
|
Freedom of religious belief |
8.51 |
8.42 |
8.49 |
8.66[15] |
8.55+/-0.13 |
-0.11 |
|
Freedom to enter or leave
|
8.17 |
8.02 |
7.85 |
8.36[15] |
8.00+/-0.15 |
-0.36[15] |
|
Freedom to engage in
|
6.96[15] |
6.82 |
6.99 |
7.29[15] |
6.99+/-0.17 |
-0.30[15] |
|
Freedom to engage in
|
7.08 |
7.09 |
6.91 |
7.52[15] |
6.96+/-0.18 |
-0.56[15] |
|
Freedom of speech |
6.90[15] |
6.59[15] |
6.59 |
7.19[15] |
6.65+/-0.18 |
-0.54[15] |
|
Freedom of procession and demonstration |
6.65 |
6.62 |
6.51 |
6.68[15] |
6.54+/-0.19 |
-0.14 |
|
Freedom of association |
6.48[15] |
6.37 |
6.46 |
6.75[15] |
6.47+/-0.18 |
-0.28[15] |
|
Freedom to strike |
6.62 |
6.76 |
6.48[15] |
6.76[15] |
6.31+/-0.20 |
-0.45[15] |
|
Freedom of publication |
6.27[15] |
5.93[15] |
6.22[15] |
6.81[15] |
6.24+/-0.19 |
-0.57[15] |
|
Freedom of press |
6.41 |
6.33 |
6.37 |
6.69[15] |
6.21+/-0.18 |
-0.48[15] |
* “Overall response rate” was used before September 2017, thereafter, “effective response rate” was used.
[13] These questions only use sub-samples of the tracking surveys concerned. The sub-sample sizes of this survey range from 589 to 673, and the increased sampling errors have already been reflected in the figures tabulated.
[14] All error figures in the table are calculated at 95% confidence level. “95% confidence level” means that if we were to repeat a certain survey 100 times, using the same questions each time but with different random samples, we would expect 95 times getting a figure within the error margins specified. Media can state “sampling error of various ratings not more than +/-0.20 at 95% confidence level” when quoting the above figures.
[15] Such changes have gone beyond the sampling errors at the 95% confidence level, meaning that they are statistically significant prima facie. However, whether numerical differences are statistically significant is not the same as whether they are practically useful or meaningful, and different weighting methods could have been applied in different surveys.
Herewith the latest figures of the 2 rule of law sub-indicators and the rating of the Chief Justice:
|
Date of survey |
15-18/2/16 |
18-21/7/16 |
6-9/2/17 |
10-13/7/17 |
15-18/1/18 |
Latest change |
|
Sample size[16] |
1,026 |
1,013 |
1,029 |
804 |
1,035 |
-- |
|
Response rate* |
66.8% |
73.6% |
70.5% |
72.0% |
63.6% |
-- |
|
Finding |
Finding |
Finding |
Finding |
Finding |
Finding & error[17] |
-- |
|
Compliance with the rule of law (repeated listing) |
6.45 |
6.19[18] |
6.63[18] |
7.08[18] |
6.29+/-0.17 |
-0.79[18] |
|
Impartiality of the courts |
6.84 |
6.67 |
6.73 |
6.93[18] |
6.54+/-0.16 |
-0.39[18] |
|
Fairness of the judicial system |
6.40[18] |
6.16[18] |
6.35[18] |
6.87[18] |
6.05+/-0.18 |
-0.82[18] |
|
Support rating of Geoffrey Ma |
65.5 |
64.6 |
66.8[18] |
68.2 |
65.1+/-1.8 |
-3.1[18] |
* “Overall response rate” was used before September 2017, thereafter, “effective response rate” was used.
[16] These questions only use sub-samples of the tracking surveys concerned. The sub-sample sizes of this survey range from 629 to 726, and the increased sampling errors have already been reflected in the figures tabulated.
[17] All error figures in the table are calculated at 95% confidence level. “95% confidence level” means that if we were to repeat a certain survey 100 times, using the same questions each time but with different random samples, we would expect 95 times getting a figure within the error margins specified. Media can state “sampling error of various ratings not more than +/-0.18 at 95% confidence level” when quoting the above figures, and that “sampling error is not more than +/-1.8 at 95% confidence level” when citing Geoffrey Ma’s rating.
[18] Such changes have gone beyond the sampling errors at the 95% confidence level, meaning that they are statistically significant prima facie. However, whether numerical differences are statistically significant is not the same as whether they are practically useful or meaningful, and different weighting methods could have been applied in different surveys.
Regarding the core social indicators, latest results showed that, on a scale of 0-10, Hong Kong’s degree of “prosperity” scored the highest rating with 6.93 marks, followed by “freedom” and “stability”, with 6.72 and 6.65 marks respectively, and then “compliance with rule of law” and “democracy”, with 6.29 and 5.74 marks respectively.
As for the non-core social indicators, “public order” has the highest score of 7.52 marks, followed by “civilization”, “efficiency”, “corruption-free practices”, “social welfare sufficiency”, “equality” and “fairness”, with scores of 6.83, 6.72, 6.30, 6.12, 5.87 and 5.47 marks correspondingly.
As for the freedom sub-indicators, the freedom of “religious belief” scored the highest rating with 8.55 marks. Freedom of “entering or leaving Hong Kong” came second with 8.00 marks. Freedoms of “artistic and literary creation”, “academic research”, “speech”, “procession and demonstration”, “association”, “freedom to strike”, “publication” and “press” formed the next tier, with respective scores of 6.99, 6.96, 6.65, 6.54, 6.47, 6.31, 6.24 and 6.21 marks.
Finally, for the two ratings of law sub-indicators, the impartiality of the courts scored 6.54 marks, while the rating of the fairness of the judicial system was 6.05 marks. Meanwhile, the latest popularity rating of Chief Justice Geoffrey Ma Tao-li, a representative figure of the judicial system, was 65.1 marks, on a scale of 0-100.
Opinion Daily
In January 2007, POP opened a feature page called “Opinion Daily” at the “POP Site”, to record significant events and selected polling figures on a day-to-day basis, in order to let readers judge by themselves the reasons for the ups and downs of different opinion figures. In July 2007, POP collaborated with Wisers Information Limited whereby Wisers supplies to POP each day starting from July 24, a record of significant events of that day, according to the research method designed by POP. These daily entries would be uploaded to “Opinion Daily” as soon as they are verified by POP.
For the polling items covered in this press release, the previous survey of some items was conducted from 10 to 13 July, 2017 while this survey was conducted from 15 to 18 January, 2018. During this period, herewith the significant events selected from counting newspaper headlines and commentaries on a daily basis and covered by at least 25% of the local newspaper articles. Readers can make their own judgment if these significant events have any impacts to different polling figures.
|
17/1/18 |
Joshua Wong and Raphael Wong are jailed by the High Court over the Mongkok protest site clearance case. |
|
6/1/18 |
Media reports on the suspected unauthorised building works found in Teresa Cheng’s property. |
|
5/1/18 |
Teresa Cheng takes over as the Secretary for Justice. |
|
3/1/18 |
Retired superintendent Franklin Chu King-wai is jailed for three months and bailed of $50,000 cash pending his appeal. |
|
27/12/17 |
The Standing Committee of the National People’s Congress passes the motion of cooperation arrangement for implementing the co-location plan. |
|
5/12/17 |
The cost of the main construction works for the MTR Shatin-Central Link is expected to overrun of 16.5 billion. |
|
27/11/17 |
The Legislative Council Commission decides to recover 11.74 millions of remuneration and operating expenses paid to Leung Kwok-hung, Law Kwun-chung, Lau Siu-lai and Yiu Chung-yim, who have been disqualified from assuming the office of Members of LegCo. |
|
4/11/17 |
The National People’s Congress Standing Committee passes decisions to include the national anthem law in Annex III of the Hong Kong Basic Law. |
|
3/11/17 |
The judge at former Chief Executive Donald Tsang’s second bribery trial dismisses the jury after they are unable to reach a verdict. |
|
13/10/17 |
Joshua Wong and the others found guilty of criminal contempt of court for obstructing bailiffs at Mong Kok rally site. |
|
21/9/17 |
Former president of the HKU’s student union Billy Fung Jing-en and vice president Colman Li Fung-kei are sentenced to community service for barging into a HKU governing council meeting last year. |
|
25/8/17 |
The Court of Final Appeal rejects the application for appeal by Leung Chung-hang and Yau Wai-ching. |
|
17/8/17 |
Joshua Wong, Nathan Law and Alex Chow have been sentenced to six to eight months in prison. |
|
14/7/17 |
The High Court disqualifies four lawmakers from the Legislative Council. |
II. Public Sentiment Index
Background
The Public Sentiment Index (PSI) compiled by POP aims at quantifying Hong Kong people’s sentiments, in order to explain and predict the likelihood of collective behaviour. PSI comprises 2 components: one being Government Appraisal (GA) Score and the other being Society Appraisal (SA) Score. GA refers to people’s appraisal of society’s governance while SA refers to people’s appraisal of the social environment. Both GA and SA scores are compiled from a respective of 4 and 6 opinion survey figures. All PSI, GA and SA scores range between 0 to 200, with 100 meaning normal, the grading reference of the scores are shown below. For methodological detailed please refer to the HKU POP Site at http://hkupop.pori.hk.
POP started to pilot study the “Public Sentiment Index” in year 2010 in collaboration with NowTV. The first survey was conducted in June 2010, followed by a series of monthly tracking surveys in 2011. There were altogether 13 surveys, covered by 11 releases from March 2011 to January 2012. All results have been uploaded to the POP Site.
At the end of June 2012, before the 15th anniversary of the handover of Hong Kong, POP officially released a “PSI analysis” with figures dating back to 1992, spanning over 20 years. Moreover, the frequency of the study was set at twice a month. In October 2012, echoing the start of a new Legislative Council, POP decided to set the cut-off date of all PSI analyses at the Sunday proceeding every 15th and last day of month, whereas the release date was set at the first Thursday following the cut-off date. In July 2017, after the 20th anniversary of the handover, POP further streamlined the release date and mode of PSI analyses to become POP Site release only for the first analysis of each month, and POP Site plus press release for the second analysis of each month. At the same time, the second release was shifted to the first Tuesday of the following month, except under special circumstances.
Cut-off date of the PSI figures released by POP today is January 28, 2018, while that of the next round of release will be February 11, 2018. The tentative release date for the next release will be February 15, 2018 (Thursday).
Latest Figures of PSI
The PSI released by POP today shows that as of January 28, 2018, the latest Public Sentiment Index (PSI) is 104.4, down 7.2 from mid-January. As for the Government Appraisal (GA) and Society Appraisal (SA), the scores are 101.3 and 99.5, down 7.0 and 5.9 respectively. The chart of PSI, GA and SA are shown below:
|
|
|||
|
Latest figure |
Public Sentiment Index
|
Government Appraisal
|
Society Appraisal
|
Recent values of PSI, GA, SA and 10 fundamental figures are tabulated as follows:
|
Release date |
16/11/17 |
5/12/17 |
14/12/17 |
2/1/18 |
18/1/18 |
6/2/18 |
Latest change [20] |
|
Cut-off date |
12/11/17 |
26/11/17 |
10/12/17 |
31/12/17 |
14/1/18 |
28/1/18 |
-- |
|
Public Sentiment Index (PSI) |
109.0 |
122.4 |
105.2 |
111.3 |
111.6 |
104.4 |
-7.2 |
|
Government Appraisal (GA) |
109.7 |
118.6 |
107.2 |
109.0 |
108.2 |
101.3 |
-7.0 |
|
Rating of CE |
58.9 |
62.9 |
55.7 |
58.3 |
58.7 |
54.4 |
-4.3 |
|
Net approval rate of CE |
15% |
23% |
12% |
12% |
15% |
4% |
-12% |
|
Mean value of people’s satisfaction with SARG |
3.0 |
3.2 |
2.9 |
3.0 |
2.9 |
2.7 |
-0.1 |
|
Mean value of people’s trust in SARG |
3.1 |
3.3 |
3.1 |
3.1 |
3.1 |
2.9 |
-0.1 |
|
Society Appraisal (SA) |
99.3 |
114.4 |
94.9 |
104.1 |
105.4 |
99.5 |
-5.9 |
|
People’s satisfaction with political condition |
2.3 |
2.3 |
2.3 |
2.1 |
2.2 |
2.1 |
-0.1 |
|
Weighting index of political condition |
0.30[19] |
0.30[19] |
0.30[19] |
0.31 |
0.31[19] |
0.31[19] |
-- |
|
People’s satisfaction with economic condition |
2.9 |
3.1 |
2.8 |
3.1 |
3.1 |
3.1 |
-- |
|
Weighting index of economic condition |
0.34[19] |
0.34[19] |
0.34[19] |
0.34 |
0.34[19] |
0.34[19] |
-- |
|
People’s satisfaction with livelihood condition |
2.6 |
3.0 |
2.5 |
2.7 |
2.7 |
2.6 |
-0.1 |
|
Weighting index of livelihood condition |
0.36[19] |
0.36[19] |
0.36[19] |
0.36 |
0.36[19] |
0.36[19] |
-- |
[19] POP will adopt the latest published weighting index figures when there are no respective updates.
[20] Latest changes are based on the differences between the exact values of the two figures, but not the rounded figures shown in the table.
As for the meaning of the score values, please refer to the following:
|
Score value |
Percentile |
Score value |
Percentile |
|
140-200 |
Highest 1% |
0-60 |
Lowest 1% |
|
125 |
Highest 5% |
75 |
Lowest 5% |
|
120 |
Highest 10% |
80 |
Lowest 10% |
|
110 |
Highest 25% |
90 |
Lowest 25% |
|
100 being normal level, meaning half above half below |
|||
The latest PSI of 104.4 can be considered as among the best 38% across the past 25 years, while the GA and SA scores of 101.3 and 99.5 can be considered as among the best 47% and 51% respectively.
Commentary
Note: The following commentary was written by Research Manager of POP, Frank Lee.
Our latest survey shows that compared to half a year ago, which is the time when the new cabinet of Carrie Lam took office, nearly all social indicators have dropped, reflecting that people appraised the Hong Kong society more negatively than 6 months before. To be specific, the ratings of 5 core social indicators (namely, the “prosperity”, “freedom”, “stability”, “rule of law” and “democracy”) have all gone down, particularly so for the “rule of law” and “democracy”, while that of “democracy” has even dropped to its record low since 2004. As for the non-core social indicators, among the 7 indicators, degrees of “civilization”, “corruption-free practices”, “social welfare sufficiency”, “equality” and “fairness” have dropped significantly. As for the 10 freedom sub-indicators, 8 of which including the freedoms of “enter or leave Hong Kong”, “artistic and literary creation”, “academic research”, “speech”, “association”, “strike”, “publication” and “press” have registered significant decreases, while the rating of “freedom to strike” has also hit its record low since 2000. In the area of rule of law, ratings of both “fairness of the judicial system” and “impartiality of the courts” have registered significant decreases while the latest support rating of Chief Justice Geoffrey Ma has also gone down by 3.1 marks to 65.1.
As for the Public Sentiment Index (PSI), the latest PSI stands at 104.4, dropped 7.2 points since mid-January. This time both component scores of PSI decreased. Specifically, the Government Appraisal (GA) Score that reflects people’s appraisal of society’s governance goes down by 7.0 points to 101.3, and the Society Appraisal (SA) Score that reflects people’s appraisal of the social environment decreased by 5.9 points to 99.5. As for the reasons affecting the ups and downs of various indicators and figures, we leave it to our readers to form their own judgment using detailed records displayed in our “Opinion Daily”.
Future Release (Tentative)
Reference Materials on Survey on PSI Please refer to the HKU POP Site at http://hkupop.pori.hk.
|


