


HKU POP releases popularity figures of Executive Councillors and the PSIBack
Press Release on Octember 3, 2017
| Detailed Findings (Public Sentiment Index Feature Page) |
| Detailed Findings (Popularity of Executive Councillors) |
Special Announcements
1. From July 2017, apart from sampling landline numbers to conduct opinion surveys, the Public Opinion Programme (POP) of The University of Hong Kong has also added mobile numbers to the sampling frame. After three months of testing, POP today formalizes the use of mixed samples as its standard for regular opinion surveys. The figures released today by POP have already incorporated landline and mobile samples, while “effective response rate” is continued to be used to describe the survey’s contact information. As for the weighting method, a two-step protocol is used. First, both the landline and mobile samples have been rim-weighted according to provisional figures obtained from the Census and Statistics Department regarding the gender-age distribution of the Hong Kong population in 2016 year-end, and the educational attainment (highest level attended) distribution as well as economic activity status distribution collected in the 2011 Census. After that, the mobile sample was rim-weighted according to the basic Public Sentiment Index (PSI) figures collected in the landline sample, and then mixed together to produce the final results. This weighting method has proved to be feasible after three months of testing, but POP will continue to review and enhance it, and keep the public informed.
2. To facilitate academic study and rational discussion, POP has already released for public examination some time ago via the “HKU POP SITE” (http://hkupop.pori.hk) the raw data of regular rating surveys of current CE Carrie Lam, former CEs CH Tung, Donald Tsang and CY Leung, along with related demographics of respondents. Please follow normal academic standards when using or citing such data.
Abstract
POP conducted a double stage survey on the ratings of Executive Councillors in September by means of random telephone surveys conducted by real interviewers. The first round of “top 5 Executive Councillors” survey conducted after the change of government shows that among the “top 5” non-official Executive Councillors, Joseph Yam and Ronny Tong are newly appointed Councillors while Regina Ip rejoined Executive Council after six months. Compared to half a year ago, the ratings of re-appointed Councillors Fanny Law and Arthur Li have both decreased, but only the rating of Arthur Li has changed beyond sampling error. In terms of absolute ratings, only Joseph Yam on the “top 5” list scores more than 50 marks. In terms of relative rankings, new Councillors Joseph Yam and Ronny Tong rank first and second, Regina Ip ranks third, while Fanny Law ranks fourth and Arthur Li remains fifth. It should be noted, however, that our list of “top 5” only includes non-official Councillors best known to the public, ranked according to their support ratings. Some of the other Councillors may well have very high or low support ratings, but because they are not the most well-known Councillors, they do not appear on the list by design. The maximum sampling error of all percentage figures is +/-3 percentage points at 95% confidence level, while that of rating figures is below +/-2.0 marks. The response rate of the rating survey is 58%.
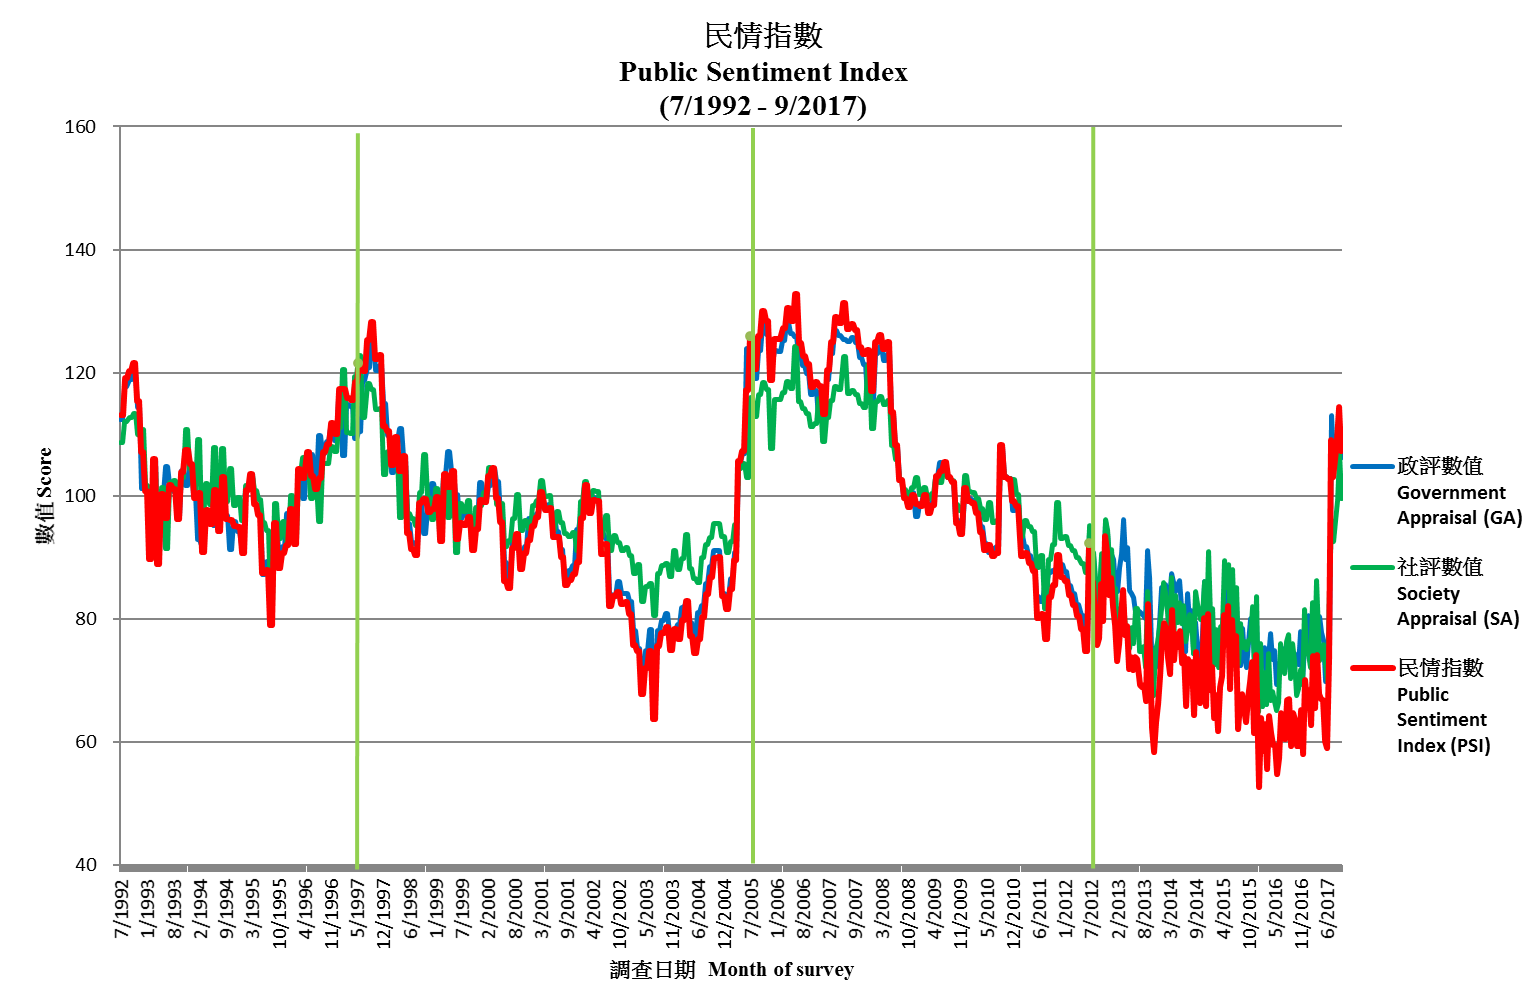
As for the Public Sentiment Index (PSI), the latest PSI stands at 107.2, reflecting a drop of 7.2 points from the historical high since 2008 recorded in early September. This time both component scores of PSI decrease. Specifically, the Government Appraisal (GA) Score that reflects people’s appraisal of society’s governance goes down by 5.6 points to 106.1, and the Society Appraisal (SA) Score that reflects people’s appraisal of the social environment decreases by 7.3 points to 99.6.
Points to note:
[1] The address of the “HKU POP SITE” is http://hkupop.pori.hk, journalists can check out the details of the survey there.
[2] The sample size of the first stage naming survey on top 5 Executive Councillors is 1,010 successful interviews, not 1,010 x 51.1% response rate, while that of the second stage rating survey is 1,017 successful interviews, not 1,017 x 57.6% response rate. In the past, many media made this mistake.
[3] The maximum sampling error of percentages is +/-3 percentage points at 95% confidence level, while the sampling error of rating figure needs another calculation. “95% confidence level” means that if we were to repeat a certain survey 100 times, using the same questions each time but with different random samples, we would expect 95 times getting a figure within the error margins specified. When quoting these figures, journalists can state “sampling error of rating not more than +/-2.0 and sampling error of percentages not more than +/-3% at 95% confidence level”.
[4] Because of sampling errors in conducting the survey(s) and the rounding procedures in processing the data, the figures cannot be too precise, and the totals may not be completely accurate. Therefore, when quoting percentages of the survey(s), journalists should refrain from reporting decimal places, but when quoting the rating figures, one decimal place can be used.
[5] The data of this survey is collected by means of random telephone interviews conducted by real interviewers, not by any interactive voice system (IVS). If a research organization uses “computerized random telephone survey” to camouflage its IVS operation, it should be considered unprofessional.
I. Popularity figures of Executive Councillors
Latest Figures
POP today releases on schedule via the “POP SITE” the latest popularity figures of Executive Councillors. From July 2017, POP enhanced the previous weighting method that has been used for quite a few years. Apart from age, gender and education, economic activity status is now also taken into account when adjusting data. The latest figures released today have been rim-weighted according to provisional figures obtained from the Census and Statistics Department regarding the gender-age distribution of the Hong Kong population in 2016 year-end, the educational attainment (highest level attended) distribution and the economic activity status distribution collected in the 2011 Census. The mobile sample has also been rim-weighted according to the basic Public Sentiment Index (PSI) figures collected in the landline sample. Herewith the contact information for the latest survey:
|
Date of survey |
Effective
|
Effective response rate |
Maximum sampling error
|
|
1-6/9/2017 (First stage naming survey) |
1,010 |
51.1%[7] |
+/-3% |
|
12-15/9/2017 (Second stage rating survey) |
1,017 |
57.6%[7] |
+/-2.0 |
[6] Calculated at 95% confidence level using full sample size. “95% confidence level” means that if we were to repeat a certain survey 100 times, using the same questions each time but with different random samples, we would expect 95 times getting a figure within the error margins specified. Sampling errors of ratings are calculated according to the distribution of the scores collected.
[7] The figures released on September 12 and 26, 2017 only included 807 and 816 landline samples, while another 203 and 201 mobile samples were still being tested. The effective response rates reported then were thus slightly different from those listed in this table.
The research design of our “Top 5 Executive Councillors” is similar to that of our “Top 10” series, it is explained in detail under “Survey Method” in our web page. From 2015 onwards, this survey series is changed from three times per year to twice per year. The top Councillors listed in our latest survey were all those who obtained the highest unprompted mentions in our first stage naming survey conducted in early September. In that survey, respondents could name, unaided, up to 5 non-official Executive Councillors whom they knew best. Latest findings of the naming survey are as follows:
|
Date of survey |
21-27/8/15 |
19-26/2/16 |
5-8/9/16 |
20-24/2/17 |
1-6/9/17 |
Latest Change in Ranking |
|
Sample base |
1,005 |
1,006 |
1,001 |
1,006 |
1,010 [8] |
-- |
|
Response rate* |
65.1% |
67.7% |
73.5% |
70.8% |
51.1% |
-- |
|
Finding / Error |
Finding |
Finding |
Finding |
Finding |
Finding & error [8] |
-- |
|
Regina Ip |
20%{1} |
18%{1} |
17%{1} |
--[9] |
22+/-3%{1} |
-- |
|
Bernard Chan |
3%{6} |
2%{8} |
3%{6} |
5%{2} |
14+/-2%{2} |
-- |
|
Joseph Yam |
--[9] |
--[9] |
--[9] |
--[9] |
9+/-2%{3}[10] |
-- |
|
Ronny Tong |
--[9] |
--[9] |
--[9] |
--[9] |
9+/-2%{4}[10] |
-- |
|
Fanny Law |
5%{5} |
4%{5} |
4%{3} |
4%{3} |
4+/-1%{5} |
↓2 |
|
Arthur Li |
6%{3} |
6%{4} |
4%{2} |
3%{4} |
3+/-1%{6} |
↓2 |
|
Ip Kwok-him |
--[9] |
--[9] |
1%{8} |
2%{7} |
2+/-1%{7} |
-- |
|
Laura Cha |
1%{10} |
1%{11} |
1%{9} |
1%{9} |
1+/-1%{8}[11] |
↑1 |
|
Tommy Cheung |
--[9] |
--[9] |
--[9] |
2%{5} |
1+/-1%{9}[11] |
↓4 |
|
Chow Chung-kong |
<1%{13} |
<1%{14} |
<1%{14} |
1%{12} |
1+/-1%{10}[11] |
↑2 |
|
Wong Kwok-kin |
--[9] |
--[9] |
--[9] |
--[9] |
1+/-1%{11}[11] |
-- |
|
Cheung Kwok-kwan |
--[9] |
--[9] |
--[9] |
--[9] |
1+/-1%{12}[11] |
-- |
|
Kenneth Lau |
--[9] |
--[9] |
--[9] |
--[9] |
1+/-1%{13}[11] |
-- |
|
Martin Liao |
--[9] |
--[9] |
--[9] |
1%{10} |
<1+/-<1%{14}[12] |
↓4 |
|
Lam Ching-choi |
--[9] |
--[9] |
--[9] |
--[9] |
<1+/-<1%{15}[12] |
-- |
|
Jeffrey Lam |
2%{9} |
1%{10} |
<1%{12} |
2%{8} |
<1+/-<1%{16}[12] |
↓8 |
|
Lam Woon-kwong |
5%{4} |
7%{3} |
4%{4} |
8%{1} |
--[9] |
-- |
|
Cheng Yiu-tong |
3%{7} |
2%{7} |
3%{5} |
2%{6} |
--[9] |
-- |
|
Cheung Chi-kong |
2%{8} |
3%{6} |
2%{7} |
1%{11} |
--[9] |
-- |
|
Anna Wu |
1%{11} |
1%{9} |
<1%{11} |
<1%{13} |
--[9] |
-- |
|
Cheung Hok-ming |
0%{15} |
1%{13} |
1%{10} |
<1%{14} |
--[9] |
-- |
|
Andrew Liao |
<1%{12} |
1%{12} |
<1%{13} |
<1%{15} |
--[9] |
-- |
|
Starry Lee |
14%{2} |
8%{2} |
--[9] |
--[9] |
--[9] |
-- |
|
Nicholas Yang |
0%{15} |
--[9] |
--[9] |
--[9] |
--[9] |
-- |
|
Wrong answer |
15% |
14% |
17% |
26% |
7+/-2% |
-- |
|
Don’t know/hard to say |
61% |
65% |
66% |
65% |
65+/-3% |
-- |
* “Overall response rate” was used before September 2017, thereafter, “effective response rate” was used.
[8] All error figures in the table are calculated at 95% confidence level. “95% confidence level”, meaning that if we were to repeat a certain survey 100 times, using the same questions each time but with different random samples, we would expect 95 times getting a figure within the error margins specified. Media can state “sampling error of percentages not more than +/-3% at 95% confidence level” when quoting the above figures. Numbers in square brackets { } indicates rankings in our naming survey. Councillors with the same recognition rate will be ranked according to the decimal place of the corresponding percentages. Please refer to the POP Site for detailed figures of the previous surveys. The error margin of previous surveys can also be found at the POP Site. The sub-sample size for this survey is 770.
[9] Not a non-official Executive Councillor during the survey period.
[10] The percentages of respondents who could name Joseph Yam and Ronny Tong were 9.0% and 8.7%, so they ranked the 3rd and the 4th respectively.
[11] The percentages of respondents who could name Laura Cha, Tommy Cheung, Chow Chung-kong, Wong Kwok-kin, Cheung Kwok-kwan and Kenneth Lau were 1.3%, 1.1%, 0.71%, 0.69%, 0.6% and 0.5%, so they ranked the 8th to 13th respectively.
[12] The percentages of respondents who could name Martin Liao, Lam Ching-choi and Jeffrey Lam were 0.28%, 0.26% and 0.22%, so they ranked the 14th to 16th respectively.
The naming survey conducted in early September showed that Regina Ip was named most frequently with a recognition rate of 22%. Bernard Chan, Joseph Yam, Ronny Tong, Fanny Law and Arthur Li had recognition rates of 14%, 9%, 9%, 4% and 3%, and were ranked the 2nd to 6th. However, 7% made a wrong attempt at citing (non-official) Executive Councillors while 65% had no clue.
The 6 Councillors who were named most frequently then entered into the second stage rating survey. During the second stage rating survey conducted in mid-September, respondents were asked to rate each short-listed Councillor in turn using a 0-100 scale. 0 indicates absolutely no support, 100 indicates absolute support, and 50 means half-half. After calculation, the bottom 1 Councillor in terms of recognition rate was dropped; the remaining 5 were then ranked according to their support ratings attained to become the top 5 Executive Councillors. Recent ratings of the top 5 members of Executive Council are summarized as follows:
|
Date of survey |
28/8-3/9/15 |
29/2-3/3/16 |
12-14/9/16 |
1-5/3/17 |
12-15/9/17 |
Latest change |
|
|
Sample base |
618-707 |
567-640 |
584-624 |
563-704 |
780-851 |
-- |
|
|
Response rate* |
66.9% |
67.7% |
70.2% |
71.7% |
57.6% |
-- |
|
|
Finding / Recognition rate |
Finding |
Finding |
Finding |
Finding |
Finding and error [13] |
Recognition
|
-- |
|
Joseph Yam |
--[16] |
--[16] |
--[16] |
--[16] |
57.9+/-1.7{1} |
85.5% |
-- |
|
Ronny Tong |
--[16] |
--[16] |
--[16] |
--[16] |
49.2+/-1.9{2} |
88.4% |
-- |
|
Regina Ip |
48.1{2} |
49.0{2} |
49.4{2} |
--[16] |
47.3+/-1.8{3} |
94.4% |
-- |
|
Fanny Law |
39.6{4} |
43.5{4}[15] |
40.6{4}[15] |
44.4{2}[15] |
41.7+/-2.0{4} |
85.8% |
-2.7 |
|
Arthur Li |
38.8{5} |
40.3{5} |
37.3{5}[15] |
39.4{5} |
36.7+/-2.0{5} |
82.0% |
-2.7[15] |
|
Bernard Chan |
54.9[14] |
-- |
54.6[14] |
50.8[14] [15] |
50.1+/-1.9[14] |
70.3% |
-0.7 |
|
Tommy Cheung |
--[16] |
--[16] |
--[16] |
40.5{4} |
-- |
-- |
-- |
|
Lam Woon-kwong |
54.3{1} |
53.1{1} |
55.6{1}[15] |
51.2{1}[15] |
--[16] |
-- |
-- |
|
Cheng Yiu-tong |
-- |
-- |
44.4{3} |
42.2{3} |
--[16] |
-- |
-- |
|
Starry Lee |
42.3{3} |
44.2{3} |
--[16] |
--[16] |
--[16] |
-- |
-- |
|
Cheung Chi-kong |
-- |
43.0[14] |
-- |
-- |
--[16] |
-- |
-- |
* “Overall response rate” was used before September 2017, thereafter, “effective response rate” was used.
[13] All error figures in the table are calculated at 95% confidence level. “95% confidence level”, meaning that if we were to repeat a certain survey 100 times, using the same questions each time but with different random samples, we would expect 95 times getting a figure within the error margins specified. Media can state “sampling error of various ratings not more than +/-2.0 marks at 95% confidence level” when quoting the above figures. Numbers in square brackets { } indicates rankings. The error margin of previous survey can be found at the POP Site.
[14] Recognition rate fell outside top 5 during rating stage, so per poll rating and related changes are presented only for rough reference and not counted in yearly average.
[15] Such changes have gone beyond the sampling errors at the 95% confidence level under the same weighting method, meaning that they are statistically significant prima facie. However, whether numerical differences are statistically significant or not is not the same as whether they are practically useful or meaningful.
[16] Not a non-official Executive Councillor during the survey period.
The latest rating survey conducted in mid-September showed that Joseph Yam was the most popularly supported non-official Executive Councillor, attaining 57.9 marks. The 2nd went to Ronny Tong with 49.2 marks. The 3rd to 5th ranks went to Regina Ip, Fanny Law and Arthur Li with 47.3, 41.7 and 36.7 marks respectively. The mean score obtained by these top 5 non-official Executive Councillors was 46.6 marks. For this latest survey, Bernard Chan obtained a support rating of 50.1 marks, but he was dropped due to his relatively low recognition rate. The overall ratings ranked according to results obtained over the past four surveys are tabulated as follows:
|
Date of survey |
29/2-3/3/16 |
12-14/9/16 |
1-5/3/17 |
12-15/9/17 |
No. of times on top 5 |
Average rating [17] |
Overall ranking [18] |
|
Fanny Law |
43.5 |
40.6 |
44.4 |
41.7 |
4 |
42.6 |
1 |
|
Arthur Li |
40.3 |
37.3 |
39.4 |
36.7 |
4 |
38.4 |
2 |
|
Lam Woon-kwong |
53.1 |
55.6 |
51.2 |
--[19] |
3 |
53.3 |
3 |
|
Regina Ip |
49.0 |
49.4 |
--[19] |
47.3 |
3 |
48.6 |
4 |
|
Cheng Yiu-tong |
-- |
44.4 |
42.2 |
--[19] |
2 |
43.3 |
5 |
|
Joseph Yam |
--[19] |
--[19] |
--[19] |
57.9 |
1 |
57.9 |
6 |
|
Ronny Tong |
--[19] |
--[19] |
--[19] |
49.2 |
1 |
49.2 |
7 |
|
Starry Lee |
44.2 |
--[19] |
--[19] |
--[19] |
1 |
44.2 |
8 |
|
Tommy Cheung |
--[19] |
--[19] |
40.5 |
-- |
1 |
40.5 |
9 |
[17] “Average rating” is the average of all ratings obtained by Executive Councillors over the past 4 surveys.
[18] “Overall ranking” is first determined by their number of times on top 5, and then their average ratings.
[19] Not a non-official Executive Councillor during the survey period.
The overall rankings in the past four surveys showed that among the current non-official Executive Councillors after the change of government, only Fanny Law and Arthur Li have been on the list for four times, with average ratings of 42.6 and 38.4 marks respectively. Regina Ip has been on the list for three times with an average rating of 48.6 marks. Joseph Yam and Ronny Tong have been on the list once with ratings of 57.9 and 49.2 marks.
Opinion Daily
In January 2007, POP opened a feature page called “Opinion Daily” at the “POP SITE”, to record significant events and selected polling figures on a day-to-day basis, in order to let readers judge by themselves the reasons for the ups and downs of different opinion figures. In July 2007, POP collaborated with Wisers Information Limited whereby Wisers supplies to POP each day starting from July 24, a record of significant events of that day, according to the research method designed by POP. These daily entries would be uploaded to “Opinion Daily” as soon as they are verified by POP.
For the polling items covered in this press release, the previous survey was conducted from March 1 to 5, 2017 while the latest survey was conducted from September 12 to 15, 2017. During this period, herewith the significant events selected from counting newspaper headlines and commentaries on a daily basis and covered by at least 25% of the local newspaper articles. Readers can make their own judgment if these significant events have any impacts to different polling figures.
|
8/9/17 |
A slogan congratulating Choi Yuk-lin on her son’s death is posted on the democracy wall at the Education University of Hong Kong. |
|
6/9/17 |
Chief Executive Carrie Lam Cheng Yuet-ngor unveils the scheme for local first-time homebuyers. |
|
17/8/17 |
Joshua Wong, Nathan Law and Alex Chow have been sentenced to six to eight months in prison. |
|
3/8/17 |
Joseph Yam Chi-kwong publishes an article titled “Public Finance in Hong Kong” on his blog. |
|
25/7/17 |
The government announces the co-location arrangement for the Express Rail Link. |
|
14/7/17 |
The High Court disqualifies four lawmakers from the Legislative Council. |
|
23/6/17 |
The Executive Council passes the proposal of abolishing the MPF offsetting mechanism. |
|
22/6/17 |
Chief Executive-elect Carrie Lam Cheng Yuet-ngor announces the Executive Council membership for the new-term Government. |
|
13/6/17 |
The Chief Executive in Council has endorsed the report and recommendations of the Standard Working Hours Committee. |
|
3/6/17 |
The Development Bureau announces the Sustainable Lantau Blueprint. |
|
17/5/17 |
The government invites the Hong Kong Housing Society to study the feasibility of building housing on the fringes of Tai Lam and Ma On Shan country parks. |
|
10/4/17 |
The government announces Life Annuity Scheme. |
II. Public Sentiment Index
Background
The Public Sentiment Index (PSI) compiled by POP aims at quantifying Hong Kong people’s sentiments, in order to explain and predict the likelihood of collective behaviour. PSI comprises 2 components: one being Government Appraisal (GA) Score and the other being Society Appraisal (SA) Score. GA refers to people’s appraisal of society’s governance while SA refers to people’s appraisal of the social environment. Both GA and SA scores are compiled from a respective of 4 and 6 opinion survey figures. All PSI, GA and SA scores range between 0 to 200, with 100 meaning normal, the grading reference of the scores are shown below. For methodological detailed please refer to the HKU POP Site at http://hkupop.pori.hk.
POP started to pilot study the “Public Sentiment Index” in year 2010 in collaboration with NowTV. The first survey was conducted in June 2010, followed by a series of monthly tracking surveys in 2011. There were altogether 13 surveys, covered by 11 releases from March 2011 to January 2012. All results have been uploaded to the POP Site.
At the end of June 2012, before the 15th anniversary of the handover of Hong Kong, POP officially released a “PSI analysis” with figures dating back to 1992, spanning over 20 years. Moreover, the frequency of the study was set at twice a month. In October 2012, echoing the start of a new Legislative Council, POP decided to set the cut-off date of all PSI analyses at the Sunday proceeding every 15th and last day of month, whereas the release date was set at the first Thursday following the cut-off date. In July 2017, after the 20th anniversary of the handover, POP further streamlined the release date and mode of PSI analyses to become POP Site release only for the first analysis of each month, and POP Site plus press release for the second analysis of each month. At the same time, the second release was shifted to the first Tuesday of the following month, except under special circumstances.
Cut-off date of the PSI figures released by POP today is September 24, 2017, while that of the next round of release will be October 8, 2017. The tentative release date for the next release will be October 12, 2017 (Thursday).
Latest Figures of PSI
The PSI released by POP today shows that as of September 24, 2017, the latest Public Sentiment Index (PSI) is 107.2, down 7.2 from early September. As for the Government Appraisal (GA) and Society Appraisal (SA), the scores are 106.1 and 99.6, down 5.6 and 7.3 respectively. The chart of PSI, GA and SA are shown below:
|
|
|||
|
Latest figure |
Public Sentiment Index
|
Government Appraisal
|
Society Appraisal
|
Recent values of PSI, GA, SA and 10 fundamental figures are tabulated as follows:
|
Release date |
13/7/17 |
1/8/17 |
17/8/17 |
5/9/17 |
14/9/17 |
3/10/17 |
Latest change[21] |
|
Cut-off date |
9/7/17 |
30/7/17 |
13/8/17 |
27/8/17 |
10/9/17 |
24/9/17 |
-- |
|
Public Sentiment Index (PSI) |
109.1 |
103.0 |
106.0 |
109.2 |
114.4 |
107.2 |
-7.2 |
|
Government Appraisal (GA) |
113.1 |
105.6 |
107.6 |
110.2 |
111.8 |
106.1 |
-5.6 |
|
Rating of CE |
63.7 |
58.5 |
59.0 |
60.2 |
59.0 |
57.4[22] |
-1.6 |
|
Net approval rate of CE |
19% |
15% |
15% |
14% |
15% |
7% |
-8% |
|
Mean value of people’s satisfaction with SARG |
2.9 |
2.7 |
2.8 |
3.0 |
3.0 |
2.9 |
-0.1 |
|
Mean value of people’s trust in SARG |
3.2 |
3.0 |
3.1 |
3.1 |
3.2 |
3.0 |
-0.2 |
|
Society Appraisal (SA) |
96.0 |
92.6 |
96.0 |
99.2 |
106.9 |
99.6 |
-7.3 |
|
People’s satisfaction with political condition |
2.3 |
2.0 |
2.2 |
2.1 |
2.4 |
2.1 |
-0.3 |
|
Weighting index of political condition |
0.30[20] |
0.30[20] |
0.30[20] |
0.30[20] |
0.30[20] |
0.30[20] |
-- |
|
People’s satisfaction with economic condition |
2.8 |
2.9 |
2.9 |
3.0 |
3.0 |
3.0 |
+0.1 |
|
Weighting index of economic condition |
0.34[20] |
0.34[20] |
0.34[20] |
0.34[20] |
0.34[20] |
0.34[20] |
-- |
|
People’s satisfaction with livelihood condition |
2.6 |
2.5 |
2.5 |
2.6 |
2.8 |
2.6 |
-0.2 |
|
Weighting index of livelihood condition |
0.36[20] |
0.36[20] |
0.36[20] |
0.36[20] |
0.36[20] |
0.36[20] |
-- |
[20] POP will adopt the latest published weighting index figures when there are no respective updates.
[21] Latest changes are based on the differences between the exact values of the two figures, but not the rounded figures shown in the table.
[22] The figures released on September 26, 2017 were only included 816 landline samples, while another 201 mobile samples were still being tested. The figures reported then were thus slightly different from those listed in this table.
As for the meaning of the score values, please refer to the following:
|
Score value |
Percentile |
Score value |
Percentile |
|
140-200 |
Highest 1% |
0-60 |
Lowest 1% |
|
125 |
Highest 5% |
75 |
Lowest 5% |
|
120 |
Highest 10% |
80 |
Lowest 10% |
|
110 |
Highest 25% |
90 |
Lowest 25% |
|
100 being normal level, meaning half above half below |
|||
The latest PSI of 107.2 can be considered as among the best 32% across the past 20 years or so, while the GA and SA scores of 106.1 and 99.6 can be considered as among the best 34% and worst 49% respectively.
Commentary
Note: The following commentary was written by Research Manager of POP, Frank Lee.
The first round of “top 5 Executive Councillors” survey conducted after the change of government shows that among the “top 5” non-official Executive Councillors, Joseph Yam and Ronny Tong are newly appointed Councillors while Regina Ip rejoined Executive Council after six months. Compared to half a year ago, the ratings of re-appointed Councillors Fanny Law and Arthur Li have both decreased, but only the rating of Arthur Li has changed beyond sampling error. In terms of absolute ratings, only Joseph Yam on the “top 5” list scores more than 50 marks. In terms of relative rankings, new Councillors Joseph Yam and Ronny Tong rank first and second, Regina Ip ranks third, while Fanny Law ranks fourth and Arthur Li remains fifth. It should be noted, however, that our list of “top 5” only includes non-official Councillors best known to the public, ranked according to their support ratings. Some of the other Councillors may well have very high or low support ratings, but because they are not the most well-known Councillors, they do not appear on the list by design.
As for the Public Sentiment Index (PSI), the latest PSI stands at 107.2, reflecting a drop of 7.2 points from the historical high since 2008 recorded in early September. This time both component scores of PSI decrease. Specifically, the Government Appraisal (GA) Score that reflects people’s appraisal of society’s governance goes down by 5.6 points to 106.1, and the Society Appraisal (SA) Score that reflects people’s appraisal of the social environment decreases by 7.3 points to 99.6. As for the reasons affecting the ups and downs of these figures, we leave it to our readers to form their own judgment using detailed records displayed in our “Opinion Daily”.
Future Release(Tentative)
Reference Materials on Survey on PSI Please refer to the HKU POP Site at http://hkupop.pori.hk.
|


