


HKU POP releases findings on people’s feeling towards different governments and peoples and the PSIBack
Press Release on September 5, 2017
| Detailed Findings (Feelings towards different Governments) |
| Detailed Findings (Feelings towards different People) |
| Detailed Findings (Public Sentiment Index Feature Page) |
Special Announcements
1. From July 2017, apart from sampling landline numbers to conduct opinion surveys, mobile numbers are also added to the sampling frame. Since it takes time to conduct further testing, the figures released today by The Public Opinion Programme (POP) of The University of Hong Kong are only based on the landline sample. The results of the mixed sample will be released after further testing is completed. Meanwhile, POP also enhanced the previous weighting method that has been used for quite a few years. Apart from age, gender and education, economic activity status is now also taken into account when adjusting data. The latest figures released today have been rim-weighted according to provisional figures obtained from the Census and Statistics Department regarding the gender-age distribution of the Hong Kong population in 2016 year-end, the educational attainment (highest level attended) distribution and the economic activity status distribution collected in the 2011 Census.
2. To facilitate academic study and rational discussion, POP has already released for public examination some time ago via the “HKU POP SITE” (http://hkupop.pori.hk) the raw data of regular rating surveys of current CE Carrie Lam, former CEs CH Tung, Donald Tsang and CY Leung, along with related demographics of respondents. Please follow normal academic standards when using or citing such data.
Abstract
POP conducted a double stage survey on Hong Kong citizens’ feeling towards different governments and peoples in August, by means of random telephone interviews conducted by real interviewers. The latest survey shows that in terms of net affinity, Hong Kong people feel more positively about all other peoples than their governments. Regarding the four cross-strait societies, the net affinity of Hong Kong people towards fellow Hongkongers is 26 percentage points higher than that towards the Hong Kong SAR Government, that towards Taiwan people is 53 percentage points higher than that towards the Taiwan Government, that towards Macau people is 21 percentage points higher than that towards the Macau Government, that towards Mainland Chinese people is 7 percentage points higher than that towards the Mainland Chinese Government. As for countries outside the cross-strait regions, Hong Kong people seem to dislike the governments of Japan and the United States whereas they seem to like all peoples rather than dislike them. These findings are worth studying by various governments. Compared to 3 months ago, the net value of Hong Kong people’s affinity towards the government of the United States has dropped from negative 16 percentage point to negative 35 percentage points, reaching its new low since 1997. It should be noted, however, that our survey only covers regions and countries best known to Hong Kong people. Hong Kong people may well like or dislike other places much more, but because they are not the most well-known places, they do not appear on the list by design. The maximum sampling error of all percentages is +/-4 percentage points at 95% confidence level while the sampling error of net values need another calculation. The response rate of the second stage opinion survey is 72%.
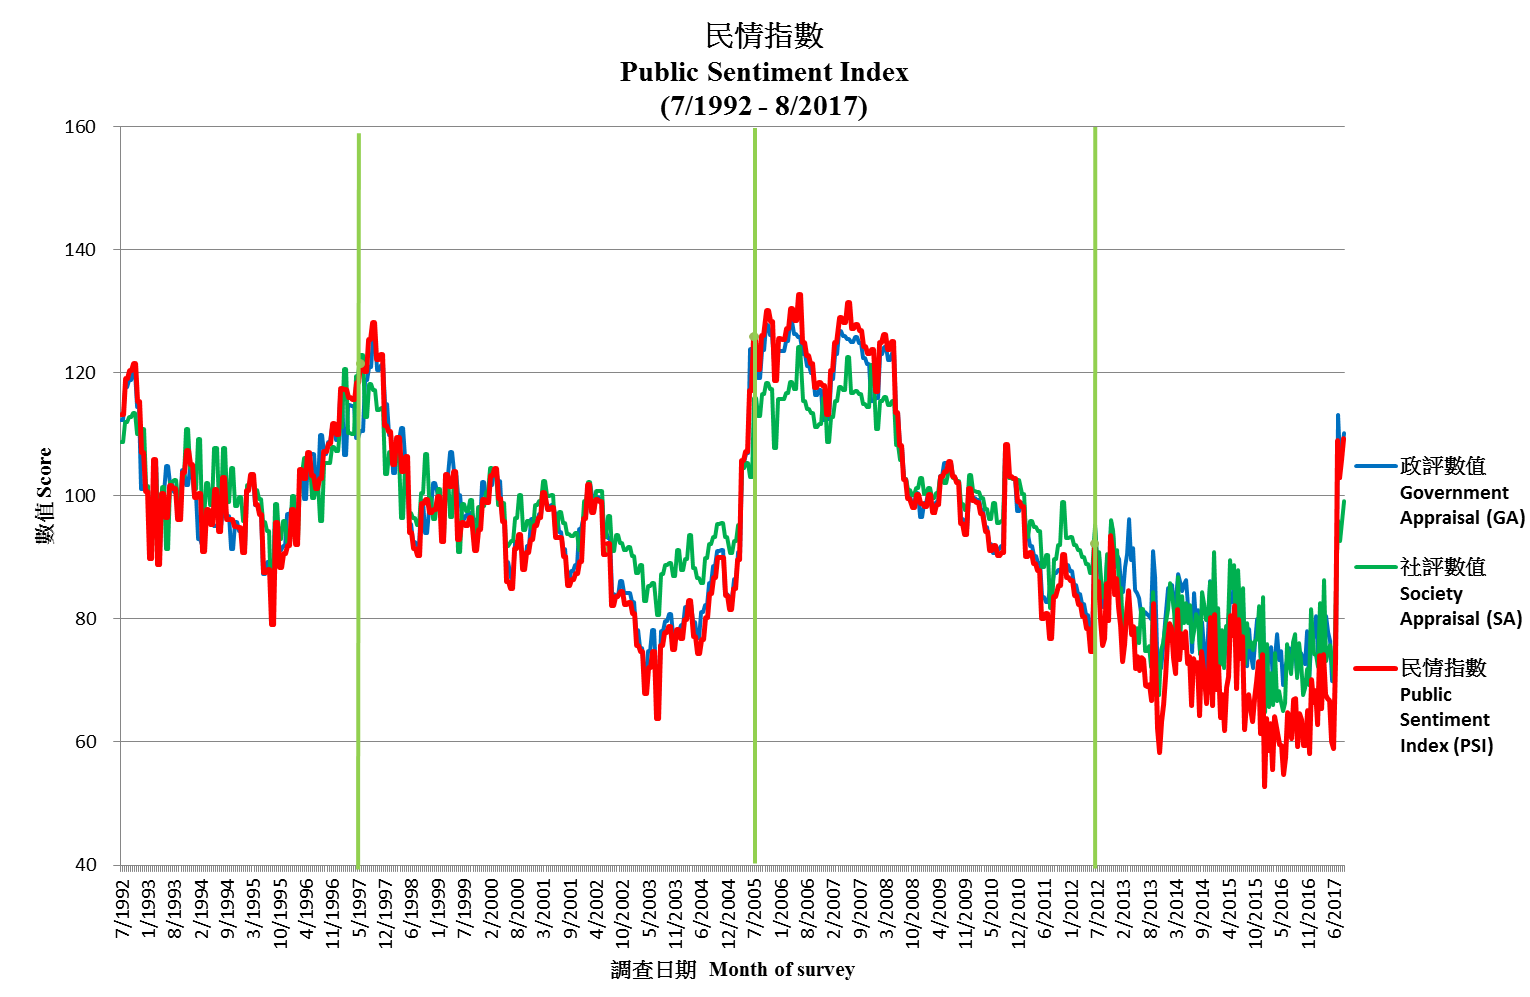
As for the Public Sentiment Index (PSI), the latest PSI stands at 109.2, back to the level registered when the new administration took office, which is a record high in five years. This time both component scores of PSI increase. Specifically, the Government Appraisal (GA) Score that reflects people’s appraisal of society’s governance goes up by 2.6 points to 110.2, and the Society Appraisal (SA) Score that reflects people’s appraisal of the social environment increases by 3.2 points to 99.2.
Points to note:
[1] The address of the “HKU POP SITE” is http://hkupop.pori.hk, journalists can check out the details of the survey there.
[2] The sample size of the first stage naming survey is 817 successful interviews, not 817 x 70.9% response rate, while the sample size of the second stage rating survey is 811 successful interviews, not 811 x 72.0% response rate. In the past, many media made this mistake.
[3] “95% confidence level” means that if we were to repeat a certain survey 100 times, using the same questions each time but with different random samples, we would expect 95 times getting a figure within the error margins specified. When quoting these figures, journalists can state “sampling error of various percentages not more than +/-4% and sampling error of net values not more than +/-7% at 95% confidence level”.
[4] Because of sampling errors in conducting the survey(s) and the rounding procedures in processing the data, the figures cannot be too precise, and the totals may not be completely accurate. Therefore, when quoting percentages of the survey(s), journalists should refrain from reporting decimal places, but when quoting the rating figures, one decimal place can be used.
[5] The data of this survey is collected by means of random telephone interviews conducted by real interviewers, not by any interactive voice system (IVS). If a research organization uses “computerized random telephone survey” to camouflage its IVS operation, it should be considered unprofessional.
I. People’s feeling towards different governments and peoples
Latest Figures
POP today releases on schedule via the “POP SITE” the survey findings on Hong Kong people’s feeling towards different governments and peoples. These surveys on governments are conducted at least once a year since 1997, while the surveys on peoples only began in 2007, this being the twenty-first time. From July 2017, POP enhanced the previous weighting method that has been used for quite a few years. Apart from age, gender and education, economic activity status is now also taken into account when adjusting data. The latest figures released today have been rim-weighted according to provisional figures obtained from the Census and Statistics Department regarding the gender-age distribution of the Hong Kong population in 2016 year-end, the educational attainment (highest level attended) distribution and the economic activity status distribution collected in the 2011 Census. Herewith the contact information for the latest survey excluding the 199 and 217 testing samples using mobile numbers:
|
Date of surveys |
Overall sample size |
Response rate |
Maximum sampling error of percentages[6] |
|
2-7/8/2017 (First stage naming survey) |
817 |
70.9% |
+/-3% |
|
16-21/8/2017 (Second stage opinion survey) |
811 |
72.0% |
+/-4% |
[6] Calculated at 95% confidence level using full sample size. “95% confidence level” means that if we were to repeat a certain survey 100 times, using the same questions each time but with different random samples, we would expect 95 times getting a figure within the error margins specified. Questions using only sub-samples would have bigger sample error. For this survey, the sub-sample size of all questions has been controlled to no less than 500. Corresponding sampling errors have been reported in the statistical tables.
The research design of our survey on “people’s feeling towards different governments and peoples” has been explained in detail under “Survey Method” in our corresponding web page. For many years, POP have selected 15 regions and countries that are best known to Hong Kong people, and conducted surveys to measure people’s feeling towards the governments of these places. Our primary objective was to map Hong Kong people’s cosmopolitan view over time. In 2007, we improved our research design. Our mid-2007 survey was divided into two stages, namely, a naming survey and an opinion survey. In the 2007 year-end survey, we further added the people module to the survey. In specific terms, in our naming survey, other than Hong Kong, Mainland China, Taiwan and Macau, respondents can name, unaided, up to ten regions or countries which they know best. The four cross-strait regions together with 12 other regions and countries most frequently mentioned in the naming stage were then shortlisted into the second stage, with their governments and peoples rated by respondents as “very positive”, “quite positive”, “half-half”, “quite negative” or “very negative”. In August 2017, as Hong Kong marks its 20th anniversary of the handover, POP again adjusted the design of this survey series, to include only the four cross-strait regions and 10 other regions and countries most frequently mentioned in the naming stage at the second stage opinion survey. In our first stage survey conducted on August 2 to 7, the United States, the United Kingdom, Japan, France and Singapore were mentioned most frequently. Please refer to the relevant table in our website for the rest of the list. Our second stage survey was conducted on August 16 to 21. The following table summarizes the findings of Hong Kong people’s feeling towards the governments and peoples of the four cross-strait regions.
|
Date of survey |
16-19/5/16 |
14-17/11/16 |
15-18/5/17 |
16-21/8/17 |
||||
|
Sample base |
1,001 |
1,007 |
1,000 |
811 |
||||
|
Overall response rate |
67.6% |
70.9% |
71.5% |
72.0% |
||||
|
Feeling towards different governments / peoples [7] |
Findings |
Findings |
Findings |
Base[8] |
Finding and error[9] |
Latest change |
Net difference with gov’ts / peoples |
|
|
Hong Kong |
People Positive |
49%[10] |
41%[10] |
41% |
641 |
48+/-4% |
+7%[10] |
+26% |
|
People Negative |
14% |
13% |
13% |
641 |
13+/-3% |
-- |
||
|
Net value |
35% |
28%[10] |
28% |
641 |
35+/-6% |
+7%[10] |
||
|
Government Positive |
24% |
22% |
28%[10] |
641 |
41+/-4% |
+13%[10] |
-26% |
|
|
Government Negative |
43%[10] |
40% |
37% |
641 |
31+/-4% |
-6%[10] |
||
|
Net value |
-19%[10] |
-17% |
-9%[10] |
641 |
10+/-7% |
+19%[10] |
||
|
Mainland |
People Positive |
27% |
33%[10] |
30% |
623 |
32+/-4% |
+2% |
+7% |
|
People Negative |
29%[10] |
25% |
29% |
623 |
28+/-4% |
-1% |
||
|
Net value |
-3% |
8%[10] |
1%[10] |
623 |
4+/-6% |
+3% |
||
|
Government Positive |
24% |
28% |
30% |
623 |
32+/-4% |
+2% |
-7% |
|
|
Government Negative |
42%[10] |
34%[10] |
37% |
623 |
35+/-4% |
-2% |
||
|
Net value |
-17%[10] |
-6%[10] |
-8% |
623 |
-3+/-7% |
+5% |
||
|
Taiwan |
People Positive |
67%[10] |
60%[10] |
65%[10] |
634 |
59+/-4% |
-6%[10] |
+53% |
|
People Negative |
3% |
4% |
4% |
634 |
4+/-1% |
-- |
||
|
Net value |
64%[10] |
56%[10] |
61%[10] |
634 |
56+/-4% |
-5% |
||
|
Government Positive |
43%[10] |
29%[10] |
32% |
634 |
24+/-3% |
-8%[10] |
-53% |
|
|
Government Negative |
10% |
15%[10] |
19%[10] |
634 |
22+/-3% |
+3%[10] |
||
|
Net value |
33%[10] |
15%[10] |
12% |
634 |
2+/-5% |
-10%[10] |
||
|
Macau |
People Positive |
49% |
50% |
50% |
610 |
45+/-4% |
-5%[10] |
+21% |
|
People Negative |
4% |
2% |
2% |
610 |
5+/-2% |
+3%[10] |
||
|
Net value |
45% |
48% |
48% |
610 |
40+/-5% |
-8%[10] |
||
|
Government Positive |
36% |
43%[10] |
36%[10] |
610 |
35+/-4% |
-1% |
-21% |
|
|
Government Negative |
17% |
11%[10] |
18%[10] |
610 |
15+/-3% |
-3% |
||
|
Net value |
18% |
32%[10] |
18%[10] |
610 |
19+/-6% |
+1% |
||
[7] Collapsed from a 5-point scale.
[8] The sample size for each question varies, but has been controlled to no
less than 500. Corresponding sampling errors have all been given.
[9] All error figures in the table are calculated at 95% confidence level.
“95% confidence level” means that if we were to repeat a certain survey 100
times, using the same questions each time but with different random
samples, we would expect 95 times getting a figure within the error margins
specified. Media can state “sampling error of percentages not more than
+/-4% and sampling error of net values not more than +/-7% at 95%
confidence level” when quoting the above figures. The error margin of
previous survey can be found at the POP Site.
[10] Such changes have gone beyond the sampling errors at the 95% confidence level under the same weighting method, meaning that they are statistically significant prima facie. However, whether numerical differences are statistically significant or not is not the same as whether they are practically useful or meaningful.
Herewith the findings of Hong Kong people’s feelings towards the governments and peoples of 10 regions and countries other than the four cross-strait regions. They are ranked according to the net values of Hong Kong people’s feelings towards their people, in descending order:
|
Date of survey |
16-19/5/16 |
14-17/11/16 |
15-18/5/17 |
16-21/8/17 |
||||
|
Sample base |
1,001 |
1,007 |
1,000 |
811 |
||||
|
Overall response rate |
67.6% |
70.9% |
71.5% |
72.0% |
||||
|
Feeling towards different governments / peoples [11] |
Findings |
Findings |
Findings |
Base[12] |
Finding and error[13] |
Latest change |
Net difference with gov’ts / peoples |
|
|
Singapore |
People Positive |
60% |
56% |
58% |
639 |
59+/-4% |
+1% |
+16% |
|
People Negative |
2% |
2% |
4% |
639 |
3+/-1% |
-1%[14] |
||
|
Net value |
58% |
54% |
54% |
639 |
56+/-4% |
+2% |
||
|
Government Positive |
52% |
49% |
51% |
639 |
53+/-4% |
+2% |
-16% |
|
|
Government Negative |
11%[14] |
12% |
13% |
639 |
13+/-3% |
-- |
||
|
Net value |
40%[14] |
38% |
38% |
639 |
40+/-6% |
+2% |
||
|
Canada |
People Positive |
55% |
51% |
58%[14] |
583 |
54+/-4% |
-4% |
+4% |
|
People Negative |
2% |
2% |
0% |
583 |
1+/-1% |
+1% |
||
|
Net value |
54% |
49%[14] |
58%[14] |
583 |
53+/-4% |
-5%[14] |
||
|
Government Positive |
52% |
49% |
52% |
583 |
51+/-4% |
-1% |
-4% |
|
|
Government Negative |
2% |
2% |
1% |
583 |
2+/-1% |
+1% |
||
|
Net value |
51%[14] |
48% |
52% |
583 |
49+/-4% |
-3% |
||
|
Japan |
People Positive |
62%[14] |
56%[14] |
62%[14] |
621 |
57+/-4% |
-5%[14] |
+67% |
|
People Negative |
8% |
10% |
9% |
621 |
8+/-2% |
-1% |
||
|
Net value |
53%[14] |
46%[14] |
53%[14] |
621 |
49+/-5% |
-4% |
||
|
Government Positive |
23%[14] |
20%[14] |
25%[14] |
621 |
21+/-3% |
-4% |
-67% |
|
|
Government Negative |
42%[14] |
41%[14] |
39% |
621 |
39+/-4% |
-- |
||
|
Net value |
-19%[14] |
-21%[14] |
-13%[14] |
621 |
-19+/-6% |
-6% |
||
|
Australia |
People Positive |
53% |
47%[14] |
51% |
617 |
47+/-4% |
-4% |
+9% |
|
People Negative |
2% |
2% |
3% |
617 |
3+/-1% |
-- |
||
|
Net value |
52% |
45%[14] |
48% |
617 |
45+/-4% |
-3% |
||
|
Government Positive |
47% |
43% |
50%[14] |
617 |
40+/-4% |
-10%[14] |
-9% |
|
|
Government Negative |
4% |
3% |
3% |
617 |
4+/-2% |
+1% |
||
|
Net value |
43% |
40% |
47%[14] |
617 |
36+/-4% |
-11%[14] |
||
|
United Kingdom |
People Positive |
54% |
46%[14] |
50% |
616 |
46+/-4% |
-4% |
+18% |
|
People Negative |
3% |
6% |
3%[14] |
616 |
4+/-2% |
+1% |
||
|
Net value |
51% |
39%[14] |
47%[14] |
616 |
42+/-5% |
-5% |
||
|
Government Positive |
44% |
40% |
46%[14] |
616 |
38+/-4% |
-8%[14] |
-18% |
|
|
Government Negative |
14%[14] |
12% |
8%[14] |
616 |
13+/-3% |
+5%[14] |
||
|
Net value |
30% |
27% |
38%[14] |
616 |
24+/-5% |
-14%[14] |
||
|
Thailand |
People Positive |
43% |
45% |
49% |
607 |
43+/-4% |
-6%[14] |
+33% |
|
People Negative |
7% |
6% |
8% |
607 |
7+/-2% |
-1% |
||
|
Net value |
37%[14] |
39% |
41% |
607 |
37+/-5% |
-4% |
||
|
Government Positive |
20%[14] |
25%[14] |
26% |
607 |
24+/-3% |
-2%[14] |
-33% |
|
|
Government Negative |
31% |
23%[14] |
23% |
607 |
21+/-3% |
-2% |
||
|
Net value |
-11% |
2%[14] |
4% |
607 |
3+/-5% |
-1% |
||
|
Germany |
People Positive |
48% |
44% |
48% |
613 |
39+/-4% |
-9%[14] |
+3% |
|
People Negative |
2% |
2% |
3% |
613 |
2+/-1% |
-1% |
||
|
Net value |
47% |
42%[14] |
45% |
613 |
36+/-4% |
-9%[14] |
||
|
Government Positive |
47% |
39%[14] |
47%[14] |
613 |
39+/-4% |
-8%[14] |
-3% |
|
|
Government Negative |
3% |
5% |
4% |
613 |
5+/-2% |
+1% |
||
|
Net value |
44% |
34%[14] |
43%[14] |
613 |
34+/-5% |
-9%[14] |
||
|
South Korea |
People Positive |
47% |
43% |
43% |
619 |
40+/-4% |
-3% |
+23% |
|
People Negative |
7% |
9% |
10% |
619 |
9+/-2% |
-1% |
||
|
Net value |
41% |
34%[14] |
33% |
619 |
30+/-5% |
-3% |
||
|
Government Positive |
38% |
22%[14] |
21% |
619 |
25+/-3% |
+4%[14] |
-23% |
|
|
Government Negative |
8% |
31%[14] |
28% |
619 |
18+/-3% |
-10%[14] |
||
|
Net value |
31% |
-9%[14] |
-7% |
619 |
8+/-5% |
+15%[14] |
||
|
France |
People Positive |
34% |
33% |
35% |
614 |
35+/-4% |
-- |
+6% |
|
People Negative |
6%[14] |
6% |
7% |
614 |
7+/-2% |
-- |
||
|
Net value |
29%[14] |
27% |
27% |
614 |
28+/-5% |
+1% |
||
|
Government Positive |
24%[14] |
23%[14] |
28%[14] |
614 |
28+/-4% |
-- |
-6% |
|
|
Government Negative |
6% |
6% |
5% |
614 |
6+/-2% |
+1% |
||
|
Net value |
18%[14] |
18% |
23%[14] |
614 |
22+/-4% |
-1% |
||
|
United States |
People Positive |
42% |
33%[14] |
39%[14] |
610 |
35+/-4% |
-4% |
+58% |
|
People Negative |
8% |
10% |
12% |
610 |
11+/-3% |
-1% |
||
|
Net value |
34% |
23%[14] |
27% |
610 |
23+/-5% |
-4% |
||
|
Government Positive |
24% |
20% |
19% |
610 |
15+/-3% |
-4%[14] |
-58% |
|
|
Government Negative |
32% |
29% |
35%[14] |
610 |
50+/-4% |
+15%[14] |
||
|
Net value |
-8% |
-9% |
-16%[14] |
610 |
-35+/-6% |
-19%[14] |
||
[11] Collapsed from a 5-point scale.
[12] The sample size for each question varies, but has been controlled to
no less than 500. Corresponding sampling errors have all been given.
[13] All error figures in the table are calculated at 95% confidence level.
“95% confidence level” means that if we were to repeat a certain survey 100
times, using the same questions each time but with different random
samples, we would expect 95 times getting a figure within the error margins
specified. Media can state “sampling error of percentages not more than
+/-4% and sampling error of net values not more than +/-6% at 95%
confidence level” when quoting the above figures. The error margin of
previous survey can be found at the POP Site.
[14] Such changes have gone beyond the sampling errors at the 95% confidence level under the same weighting method, meaning that they are statistically significant prima facie. However, whether numerical differences are statistically significant or not is not the same as whether they are practically useful or meaningful.
Our latest findings showed that, as regards the results of people’s feeling towards different peoples, 48% felt positive towards Hong Kong people themselves while the net value was positive 35 percentage points. For the other cross-strait regions, the corresponding positive figures for the Mainland, Taiwan and Macau peoples were 32%, 59% and 45% while their net values were positive 4, positive 56 and positive 40 percentage points respectively. As for the feelings on peoples of other regions and countries, the net values for Singapore and Canada were highest, with positive 56 and positive 53 percentage points respectively, while those for Japan, Australia, the United Kingdom, Thailand, Germany and South Korea were positive 49, positive 45, positive 42, positive 37, positive 36 and positive 30 percentage points correspondingly. Lastly, the net value of feeling towards the people of France and the United States were positive 28 and positive 23 percentage points only.
Regarding the results of people’s feeling towards different governments, 41% felt positive towards the HKSAR government while the net value was positive 10 percentage points. For the other cross-strait governments, the corresponding positive figures for the Mainland, Taiwan and Macau governments were 32%, 24% and 35% while their net values were negative 3, positive 2 and positive 19 percentage points respectively. As for the feelings on other governments, the net values for Canada and Singapore were the highest, with positive 49 and positive 40 percentage points correspondingly, while those for Australia, Germany, the United Kingdom and France were positive 36, positive 34, positive 24 and positive 22 percentage points correspondingly. Those for South Korea and Thailand were positive 8 and positive 3 percentage points correspondingly, while those for Japan and the United States were negative 19 and negative 35 percentage points correspondingly.
Opinion Daily
In January 2007, POP opened a feature page called “Opinion Daily” at the “POP Site”, to record significant events and selected polling figures on a day-to-day basis, in order to let readers judge by themselves the reasons for the ups and downs of different opinion figures. In July 2007, POP collaborated with Wisers Information Limited whereby Wisers supplies to POP each day starting from July 24, a record of significant events of that day, according to the research method designed by POP. These daily entries would be uploaded to “Opinion Daily” as soon as they are verified by POP.
For the polling items covered in this press release, the previous survey was conducted from 15 to 18 May, 2017 while this survey was conducted from 16 to 21 August, 2017. During this period, herewith the significant events selected from counting newspaper headlines and commentaries on a daily basis and covered by at least 25% of the local newspaper articles. Readers can make their own judgment if these significant events have any impacts to different polling figures.
|
21/8/17 |
Chief Executive Carrie Lam Cheng Yuet-ngor states that there is no political interference in Hong Kong’s judiciary system. |
|
17/8/17 |
Joshua Wong, Nathan Law and Alex Chow have been sentenced to six to eight months in prison. |
|
16/8/17 |
Democrat Howard Lam is prosecuted of misleading police officer. |
|
11/8/17 |
Democrat Howard Lam claims he was kidnapped by mainland agents. |
|
11/8/17 |
Global stocks fall as tensions rise between the United States and North Korea. |
|
30/7/17 |
China holds military parade to celebrate the 90th anniversary of the People’s Liberation Army. |
|
25/7/17 |
The government announces the co-location arrangement for the Express Rail Link. |
|
14/7/17 |
The High Court disqualifies four lawmakers from the Legislative Council. |
|
28/6/17 |
Xi Jinping visits Hong Kong for handover anniversary. |
|
23/6/17 |
The Executive Council passes the proposal of abolishing the MPF offsetting mechanism. |
|
9/6/17 |
United Kingdom general election 2017. |
|
4/6/17 |
A terrorist attack takes place at London Bridge. |
|
2/6/17 |
The United States decides to withdraw from the Paris Climate Accord. |
II. Public Sentiment Index
Background
The Public Sentiment Index (PSI) compiled by POP aims at quantifying Hong Kong people’s sentiments, in order to explain and predict the likelihood of collective behaviour. PSI comprises 2 components: one being Government Appraisal (GA) Score and the other being Society Appraisal (SA) Score. GA refers to people’s appraisal of society’s governance while SA refers to people’s appraisal of the social environment. Both GA and SA scores are compiled from a respective of 4 and 6 opinion survey figures. All PSI, GA and SA scores range between 0 to 200, with 100 meaning normal, the grading reference of the scores are shown below. For methodological detailed please refer to the HKU POP Site at http://hkupop.pori.hk.
POP started to pilot study the “Public Sentiment Index” in year 2010 in collaboration with NowTV. The first survey was conducted in June 2010, followed by a series of monthly tracking surveys in 2011. There were altogether 13 surveys, covered by 11 releases from March 2011 to January 2012. All results have been uploaded to the POP Site.
At the end of June 2012, before the 15th anniversary of the handover of Hong Kong, POP officially released a “PSI analysis” with figures dating back to 1992, spanning over 20 years. Moreover, the frequency of the study was set at twice a month. In October 2012, echoing the start of a new Legislative Council, POP decided to set the cut-off date of all PSI analyses at the Sunday proceeding every 15th and last day of month, whereas the release date was set at the first Thursday following the cut-off date. In July 2017, after the 20th anniversary of the handover, POP further streamlined the release date and mode of PSI analyses to become POP Site release only for the first analysis of each month, and POP Site plus press release for the second analysis of each month. At the same time, the second release was shifted to the first Tuesday of the following month, except under special circumstances.
Cut-off date of the PSI figures released by POP today is August 27, 2017, while that of the next round of release will be September 10, 2017. The tentative release date for the next release will be September 14, 2017 (Thursday).
Latest Figures of PSI
The PSI released by POP today shows that as of August 27, 2017, the latest Public Sentiment Index (PSI) is 109.2, up 3.3 from early August. As for the Government Appraisal (GA) and Society Appraisal (SA), the scores are 110.2 and 99.2, up 2.6 and 3.2 respectively. The chart of PSI, GA and SA are shown below:
|
|
|||
|
Latest figure |
Public Sentiment Index
|
Government Appraisal
|
Society Appraisal
|
Recent values of PSI, GA, SA and 10 fundamental figures are tabulated as follows:
|
Release date |
15/6/17 |
29/6/17 |
13/7/17 |
1/8/17 |
17/8/17 |
5/9/17 |
Latest change[16] |
|
Cut-off date |
11/6/17 |
25/6/17 |
9/7/17 |
30/7/17 |
13/8/17 |
27/8/17 |
-- |
|
Public Sentiment Index (PSI) |
59.0 |
73.4 |
109.1 |
103.0 |
106.0 |
109.2 |
+3.3 |
|
Government Appraisal (GA) |
70.9 |
76.7 |
113.1 |
105.6 |
107.6 |
110.2 |
+2.6 |
|
Rating of CE |
37.6 |
38.7 |
63.7 |
58.5 |
59.0 |
60.2 |
+1.2 |
|
Net approval rate of CE |
-54% |
-50% |
19% |
15% |
15% |
14% |
-1% |
|
Mean value of people’s satisfaction with SARG |
2.5 |
2.6 |
2.9 |
2.7 |
2.8 |
3.0 |
+0.1 |
|
Mean value of people’s trust in SARG |
2.8 |
3.0 |
3.2 |
3.0 |
3.1 |
3.1 |
-- |
|
Society Appraisal (SA) |
69.8 |
85.5 |
96.0 |
92.6 |
96.0 |
99.2 |
+3.2 |
|
People’s satisfaction with political condition |
2.0 |
2.2 |
2.3 |
2.0 |
2.2 |
2.1 |
-0.1 |
|
Weighting index of political condition |
0.30[15] |
0.30 |
0.30[15] |
0.30[15] |
0.30[15] |
0.30[15] |
-- |
|
People’s satisfaction with economic condition |
2.7 |
3.0 |
2.8 |
2.9 |
2.9 |
3.0 |
+0.1 |
|
Weighting index of economic condition |
0.34[15] |
0.34 |
0.34[15] |
0.34[15] |
0.34[15] |
0.34[15] |
-- |
|
People’s satisfaction with livelihood condition |
2.4 |
2.6 |
2.6 |
2.5 |
2.5 |
2.6 |
+0.1 |
|
Weighting index of livelihood condition |
0.35[15] |
0.36 |
0.36[15] |
0.36[15] |
0.36[15] |
0.36[15] |
-- |
[15] POP will adopt the latest published weighting index figures when there are no respective updates.
[16] Latest changes are based on the differences between the exact values of the two figures, but not the rounded figures shown in the table.
As for the meaning of the score values, please refer to the following:
|
Score value |
Percentile |
Score value |
Percentile |
|
140-200 |
Highest 1% |
0-60 |
Lowest 1% |
|
125 |
Highest 5% |
75 |
Lowest 5% |
|
120 |
Highest 10% |
80 |
Lowest 10% |
|
110 |
Highest 25% |
90 |
Lowest 25% |
|
100 being normal level, meaning half above half below |
|||
The latest PSI of 109.2 can be considered as among the best 27% across the past 20 years or so, while the GA and SA scores of 110.2 and 99.2 can be considered as among the best 25% and worst 48% respectively.
Commentary
Note: The following commentary was written by Senior Data Analyst of POP, Edward Tai.
Our latest survey shows that, in terms of net affinity, Hong Kong people feel more positively about all other peoples than their governments. Regarding the four cross-strait societies, the net affinity of Hong Kong people towards fellow Hongkongers is 26 percentage points higher than that towards the Hong Kong SAR Government, that towards Taiwan people is 53 percentage points higher than that towards the Taiwan Government, that towards Macau people is 21 percentage points higher than that towards the Macau Government, that towards Mainland Chinese people is 7 percentage points higher than that towards the Mainland Chinese Government. As for countries outside the cross-strait regions, Hong Kong people seem to dislike the governments of Japan and the United States whereas they seem to like all peoples rather than dislike them. These findings are worth studying by various governments. Compared to 3 months ago, the net value of Hong Kong people’s affinity towards the government of the United States has dropped from negative 16 percentage point to negative 35 percentage points, reaching its new low since 1997. It should be noted, however, that our survey only covers regions and countries best known to Hong Kong people. Hong Kong people may well like or dislike other places much more, but because they are not the most well-known places, they do not appear on the list by design.
As for the Public Sentiment Index (PSI), the latest PSI stands at 109.2, back to the level registered when the new administration took office, which is a record high in five years. This time both component scores of PSI increase. Specifically, the Government Appraisal (GA) Score that reflects people’s appraisal of society’s governance goes up by 2.6 points to 110.2, and the Society Appraisal (SA) Score that reflects people’s appraisal of the social environment increases by 3.2 points to 99.2. As for the reasons affecting the ups and downs of these figures, we leave it to our readers to form their own judgment using detailed records displayed in our “Opinion Daily”.
Future Release (Tentative)
Reference Materials on Survey on PSI Please refer to the HKU POP Site at http://hkupop.pori.hk.
|


