


HKU POP releases popularity figures of CE and the Government and the PSI Back
Press Release on August 1, 2017
| Detailed Findings (Rating of Chief Executive Carrie Lam) | (People's Satisfaction with the HKSAR Government)
| Detailed Findings (Public Sentiment Index Feature Page) |
Special Announcements
1. From July 2017, apart from sampling landline numbers to conduct opinion surveys, mobile numbers are also added to the sampling frame. Since it takes time to conduct further testing, the figures released today by The Public Opinion Programme (POP) of The University of Hong Kong are only based on the landline sample. The results of the mixed sample will be released after further testing is completed. Meanwhile, POP also enhanced the previous weighting method that has been used for quite a few years. Apart from age, gender and education, economic activity status is now also taken into account when adjusting data. The latest figures released today have been rim-weighted according to provisional figures obtained from the Census and Statistics Department regarding the gender-age distribution of the Hong Kong population in 2016 year-end, the educational attainment (highest level attended) distribution and the economic activity status distribution collected in the 2011 Census.
2. To facilitate academic study and rational discussion, POP has already released for public examination some time ago via the “HKU POP SITE” (http://hkupop.pori.hk) the raw data of all regular rating surveys of former CEs CH Tung, Donald Tsang and CY Leung, along with related demographics of respondents. POP today releases the raw data of the second CE rating survey of Carrie Lam after she took office. Please follow normal academic standards when using or citing such data.
Abstract
POP interviewed 817 Hong Kong people between 17 and 20 July 2017 by means of a random telephone survey conducted by real interviewers. Our latest survey shows that the popularity rating of CE Carrie Lam has decreased significantly by 5.2 marks to 58.5 compared to early July. Her latest approval rate is 50%, disapproval rate 35%, giving a net popularity of positive 15 percentage points. As for the SAR Government, its popularity has not changed much compared to two weeks ago. Its satisfaction rate now stands at 35%, dissatisfaction rate 41%, giving a net satisfaction rate of negative 7 percentage points while its latest net trust stands at positive 10 percentage points. As for society’s appraisals, among economic, livelihood and political conditions, people remain to be least satisfied with the current political condition. The three net satisfactions are negative 1, negative 27 and negative 51 percentage points respectively. Indepth analysis shows that the younger and the more educated the respondents, the more critical they are of Carrie Lam as CE in terms of both support rate and rating. As for the Public Sentiment Index (PSI), the rising trend has receded in late July. The latest PSI stands at 103.0, down 6.0 points from the record high of 109.1 in early July. This time both component scores of PSI decrease. Specifically, the Government Appraisal (GA) Score that reflects people’s appraisal of society’s governance goes down by 7.5 points to 105.6, and the Society Appraisal (SA) Score that reflects people’s appraisal of the social environment decreases by 3.4 points to 92.6. The maximum sampling error of all percentage figures is +/-4 percentage points at 95% confidence level, while the sampling error of rating figures and net values need another calculation. The response rate of the survey is 72%.
Points to note:
[1] The address of the “HKU POP SITE” is http://hkupop.pori.hk, journalists can check out the details of the survey there.
[2] The sample size of this survey is 817 successful interviews, not 817 x 71.6% response rate. In the past, many media made this mistake.
[3] The maximum sampling error of percentages is +/-4 percentage points at 95% confidence level, while the sampling error of rating figure and net value needs another calculation. “95% confidence level” means that if we were to repeat a certain survey 100 times, using the same questions each time but with different random samples, we would expect 95 times getting a figure within the error margins specified. When quoting these figures, journalists can state “sampling error of rating not more than +/-1.8 and sampling error of percentages not more than +/-4%, sampling error of net values not more than +/-7% at 95% confidence level”.
[4] Because of sampling errors in conducting the survey(s) and the rounding procedures in processing the data, the figures cannot be too precise, and the totals may not be completely accurate. Therefore, when quoting percentages of the survey(s), journalists should refrain from reporting decimal places, but when quoting the rating figures, one decimal place can be used.
[5] The data of this survey is collected by means of random telephone interviews conducted by real interviewers, not by any interactive voice system (IVS). If a research organization uses “computerized random telephone survey” to camouflage its IVS operation, it should be considered unprofessional.
Latest Figures
I. CE and the Government
POP today releases on schedule via the “POP SITE” the latest popularity figures of CE Carrie Lam and the HKSAR Government. From July 2017, POP enhanced the previous weighting method that has been used for quite a few years. Apart from age, gender and education, economic activity status is now also taken into account when adjusting data. The latest figures released today have been rim-weighted according to provisional figures obtained from the Census and Statistics Department regarding the gender-age distribution of the Hong Kong population in 2016 year-end, the educational attainment (highest level attended) distribution and the economic activity status distribution collected in the 2011 Census. Herewith the contact information for the latest survey excluding the 203 testing samples using mobile numbers:
|
Date of survey |
Overall sample size |
Response rate |
Maximum sampling error of percentages[6] |
|
17-20/7/2017 |
817 |
71.6% |
+/-3% |
[6] Errors are calculated at 95% confidence level using full sample size. “95% confidence level” means that if we were to repeat a certain survey 100 times, using the same questions each time but with different random samples, we would expect 95 times getting a figure within the error margins specified. Questions using only sub-samples would have bigger sampling error. Sampling errors of ratings are calculated according to the distribution of the scores collected.
Recent popularity figures of CE Carrie Lam and the HKSAR Government, as well as people’s appraisal of society’s conditions are summarized as follows:
|
Date of survey |
8-11/5/17 |
22-25/5/17 |
5-8/6/17 |
19-22/6/17 |
3-6/7/17 |
17-20/7/17 |
Latest change |
|
Sample base |
1,004 |
1,003 |
1,036 |
1,007 |
832 |
817 |
-- |
|
Overall response rate |
72.1% |
69.7% |
69.4% |
71.2% |
71.5% |
71.6% |
-- |
|
Finding |
Finding |
Finding |
Finding |
Finding |
Finding |
Finding and error [7] |
-- |
|
Rating of CE Carrie Lam |
56.7[9] |
54.0[9] |
54.7 |
52.2[9] |
63.7[9] |
58.5+/-1.8 |
-5.2[9] |
|
Vote of confidence in CE Carrie Lam |
47%[9] |
46% |
49% |
45%[9] |
52%[9] |
50+/-4% |
-2% |
|
Vote of no confidence in CE Carrie Lam |
44%[9] |
45% |
44% |
41% |
34%[9] |
35+/-3% |
+1% |
|
Net approval rate |
3%[9] |
<1% |
6% |
4% |
19%[9] |
15+/-6% |
-4% |
|
Satisfaction rate of SARG performance[8] |
28% |
23%[9] |
27% |
27% |
35%[9] |
35+/-4% |
-- |
|
Dissatisfaction rate of SARG performance[8] |
52% |
56% |
51%[9] |
47% |
39%[9] |
41+/-4% |
+2% |
|
Net satisfaction rate |
-24% |
-33%[9] |
-25%[9] |
-20% |
-4%[9] |
-7+/-7% |
-3% |
|
Mean value[8] |
2.5 (Base=578) |
2.4 (Base=628) |
2.5 (Base=612) |
2.6 (Base=577) |
2.9[9] (Base=481) |
2.7+/-0.1 (Base=606) |
-0.2[9] |
|
Trust in HKSAR Government[8] |
41% |
37% |
39% |
44%[9] |
47% |
46+/-4% |
-1% |
|
Distrust in HKSAR Government[8] |
42% |
44% |
43% |
37%[9] |
33% |
36+/-4% |
+3% |
|
Net trust |
-1% |
-7% |
-4% |
7%[9] |
14% |
10+/-7% |
-4% |
|
Mean value[8] |
2.9 (Base=580) |
2.8 (Base=623) |
2.8 (Base=609) |
3.0[9] (Base=572) |
3.2[9] (Base=499) |
3.0+/-0.1 (Base=624) |
-0.2[9] |
|
Current economic condition:
|
35% |
29%[9] |
32% |
40%[9] |
30%[9] |
37+/-3% |
+7%[9] |
|
Current economic condition:
|
38%[9] |
45%[9] |
45% |
32%[9] |
42%[9] |
38+/-3% |
-4%[9] |
|
Net satisfaction rate |
-4% |
-16%[9] |
-14% |
8%[9] |
-12%[9] |
-1+/-6% |
+11%[9] |
|
Mean value |
2.9 (Base=989) |
2.7[9] (Base=985) |
2.7 (Base=1,024) |
3.0[9] (Base=987) |
2.8[9] (Base=813) |
2.9+/-0.1 (Base=807) |
+0.1 |
|
Current livelihood condition:
|
24% |
23% |
21% |
24% |
27% |
26+/-3% |
-1% |
|
Current livelihood condition:
|
54% |
55% |
58% |
49%[9] |
51% |
52+/-3% |
+1% |
|
Net satisfaction rate |
-30% |
-32% |
-36% |
-25%[9] |
-23% |
-27+/-6% |
-4% |
|
Mean value |
2.5 (Base=993) |
2.5 (Base=994) |
2.4 (Base=1,026) |
2.6[9] (Base=994) |
2.6 (Base=815) |
2.5+/-0.1 (Base=800) |
-0.1 |
|
Current political condition:
|
13% |
12% |
12% |
14% |
20%[9] |
15+/-2% |
-5%[9] |
|
Current political condition:
|
69% |
71% |
71% |
62%[9] |
60% |
66+/-3% |
+6%[9] |
|
Net satisfaction rate |
-56% |
-58% |
-59% |
-47%[9] |
-40%[9] |
-51+/-5% |
-11%[9] |
|
Mean value |
2.0 (Base=974) |
2.0 (Base=946) |
2.0 (Base=985) |
2.2[9] (Base=922) |
2.3 (Base=795) |
2.0+/-0.1 (Base=761) |
-0.3[9] |
[7] All error figures in the table are calculated at 95% confidence level. “95% confidence level” means that if we were to repeat a certain survey 100 times, using the same questions each time but with different random samples, we would expect 95 times getting a figure within the error margins specified. Media can state “sampling error of rating not more than +/-1.8, sampling error of percentages not more than +/-4%, sampling error of net values not more than +/-7% at 95% confidence level” when quoting the above figures. The error margin of previous survey can be found at the POP Site.
[8] Collapsed from a 5-point scale. The mean value is calculated by quantifying all individual responses into 1, 2, 3, 4, 5 marks according to their degree of positive level, where 1 is the lowest and 5 the highest, and then calculate the sample mean. This question only uses sub-samples of the tracking surveys concerned. The sample size for this series is 639.
[9] Such changes have gone beyond the sampling errors at the 95% confidence level, meaning that they are statistically significant prima facie. However, whether numerical differences are statistically significant or not is not the same as whether they are practically useful or meaningful.
The latest survey showed that CE Carrie Lam scored 58.5 marks, and 50% supported her as CE, her net approval rate is positive 15 percentage points. Regarding people’s appraisal of the overall performance of the HKSAR Government, the latest figures revealed that 35% were satisfied, whereas 41% were dissatisfied, thus net satisfaction stands at negative 7 percentage points. The mean score is 2.7, which is in between “quite dissatisfied” and “half-half”. Meanwhile, 46% of the respondents trusted the HKSAR Government, the net trust value is positive 10 percentage points, while the mean score is 3.0, meaning close to “half-half” in general. As for people’s satisfaction with the current economic, livelihood and political conditions, the latest satisfaction rates were 37%, 26% and 15% respectively, while their net satisfaction rates in these conditions were negative 1, negative 27 and negative 51 percentage points. The mean scores of the economic, livelihood and political conditions were 2.9, 2.5 and 2.0, meaning between “half-half” and “quite dissatisfied” in general.
Indepth Analysis
In the survey, we also asked respondents for their age and education attainment. If they were reluctant to give their exact age, they could give us a range. Herewith further analysis of the support rating and support rate of Carrie Lam as Chief Executive by respondents’ age and education attainment, with sub-sample size placed in brackets:
|
Date of survey: 17-20/7/2017 |
18-29 |
30-49 |
50 or above |
Overall sample |
|
|
Rating of CE Carrie Lam[10] |
42.3+/-4.3
|
54.6+/-2.9
|
67.8+/-2.4
|
58.5+/-1.8
|
|
|
Support / Oppose Carrie Lam as CE[10] |
Support |
16+/-6%
|
43+/-6%
|
68+/-5%
|
50+/-4%
|
|
Oppose |
73+/-8%
|
41+/-6%
|
17+/-4%
|
35+/-3%
|
|
|
Don’t know / Hard to say |
11+/-5%
|
16+/-4%
|
16+/-4%
|
15+/-3%
|
|
|
Total |
100%
|
100%
|
100%
|
100%
|
|
[10] Differences among sub-groups are tested to be statistically significant at 99% confidence level.
|
Date of survey: 17-20/7/2017 |
Primary or below |
Secondary |
Tertiary or above |
Overall sample |
|
|
Rating of CE Carrie Lam[11] |
71.1+/-3.2
|
58.1+/-2.6
|
49.6+/-3.4
|
58.5+/-1.8
|
|
|
Support / Oppose Carrie Lam as CE[11] |
Support |
69+/-7%
|
51+/-5%
|
33+/-6%
|
50+/-4%
|
|
Oppose |
12+/-5%
|
36+/-5%
|
53+/-7%
|
35+/-3%
|
|
|
Don’t know / Hard to say |
20+/-6%
|
14+/-3%
|
14+/-5%
|
15+/-3%
|
|
|
Total |
100%
|
100%
|
100%
|
100%
|
|
[11] Differences among sub-groups are tested to be statistically significant at 99% confidence level.
Opinion Daily
In January 2007, POP opened a feature page called “Opinion Daily” at the “POP Site”, to record significant events and selected polling figures on a day-to-day basis, in order to let readers judge by themselves the reasons for the ups and downs of different opinion figures. In July 2007, POP collaborated with Wisers Information Limited whereby Wisers supplies to POP each day starting from July 24, a record of significant events of that day, according to the research method designed by POP. These daily entries would be uploaded to “Opinion Daily” as soon as they are verified by POP.
For the polling items covered in this press release, the previous survey of some items was conducted from 19 to 22 June, 2017 while this survey was conducted from 17 to 20 July, 2017. During this period, herewith the significant events selected from counting newspaper headlines and commentaries on a daily basis and covered by at least 25% of the local newspaper articles. Readers can make their own judgment if these significant events have any impacts to different polling figures.
|
19/7/17 |
The Legislative Council Finance Committee approves the funding request of $3.6 billion for new educational resources. |
|
14/7/17 |
The High Court disqualifies four lawmakers from the Legislative Council. |
|
12/7/17 |
DSE results announcement. |
|
5/7/17 |
Chief Executive Carrie Lam Cheng Yuet-ngor attends the Legislative Council question-and-answer session. |
|
1/7/17 |
Xi Jinping attends the Inaugural Ceremony of the Fifth Term HKSAR Government. |
|
23/6/17 |
The Executive Council passes the proposal of abolishing the MPF offsetting mechanism. |
|
22/6/17 |
Chief Executive-elect Carrie Lam Cheng Yuet-ngor announces the Executive Council membership for the new-term Government. |
|
21/6/17 |
The State Council, on the nomination of Chief Executive-elect Carrie Lam Cheng Yuet-ngor, appoints principal officials of the fifth-term Government of the HKSAR. |
II. Public Sentiment Index
Background
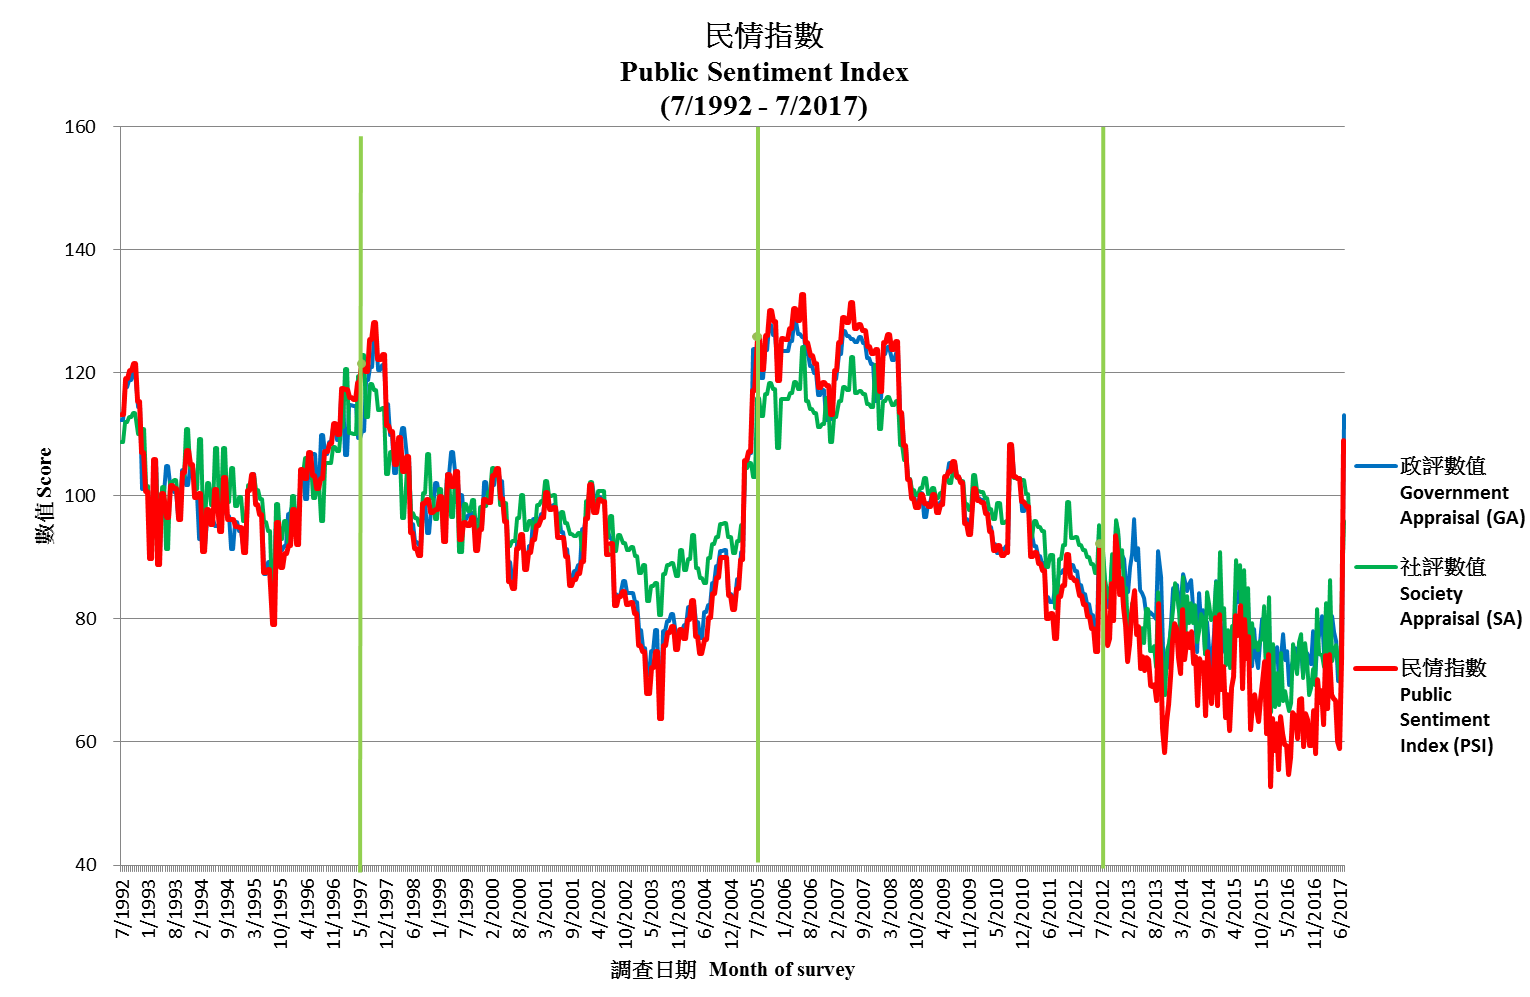
The Public Sentiment Index (PSI) compiled by POP aims at quantifying Hong Kong people’s sentiments, in order to explain and predict the likelihood of collective behaviour. PSI comprises 2 components: one being Government Appraisal (GA) Score and the other being Society Appraisal (SA) Score. GA refers to people’s appraisal of society’s governance while SA refers to people’s appraisal of the social environment. Both GA and SA scores are compiled from a respective of 4 and 6 opinion survey figures. All PSI, GA and SA scores range between 0 to 200, with 100 meaning normal, the grading reference of the scores are shown below. For methodological detailed please refer to the HKU POP Site at http://hkupop.pori.hk.
POP started to pilot study the “Public Sentiment Index” in year 2010 in collaboration with NowTV. The first survey was conducted in June 2010, followed by a series of monthly tracking surveys in 2011. There were altogether 13 surveys, covered by 11 releases from March 2011 to January 2012. All results have been uploaded to the POP Site.
At the end of June 2012, before the 15th anniversary of the handover of Hong Kong, POP officially released a “PSI analysis” with figures dating back to 1992, spanning over 20 years. Moreover, the frequency of the study was set at twice a month. In October 2012, echoing the start of a new Legislative Council, POP decided to set the cut-off date of all PSI analyses at the Sunday proceeding every 15th and last day of month, whereas the release date was set at the first Thursday following the cut-off date. In July 2017, after the 20th anniversary of the handover, POP further streamlined the release date and mode of PSI analyses to become POP Site release only for the first analysis of each month, and POP Site plus press release for the second analysis of each month. At the same time, the second release was shifted to the first Tuesday of the following month, except under special circumstances.
Cut-off date of the PSI figures released by POP today is July 30, 2017, while that of the next round of release will be August 13, 2017. The tentative release date for the next release will be August 17, 2017 (Thursday).
Latest Figures of PSI
The PSI released by POP today shows that as of July 30, 2017, the latest Public Sentiment Index (PSI) is 103.0, down 6.0 from early July. As for the Government Appraisal (GA) and Society Appraisal (SA), the scores are 105.6 and 92.6, down 7.5 and 3.4 respectively. The chart of PSI, GA and SA are shown below:
|
|
|||
|
Latest figure |
Public Sentiment Index
|
Government Appraisal
|
Society Appraisal
|
Recent values of PSI, GA, SA and 10 fundamental figures are tabulated as follows:
|
Release date |
18/5/17 |
1/6/17 |
15/6/17 |
29/6/17 |
13/7/17 |
1/8/17 |
Latest change[13] |
|
Cut-off date |
14/5/17 |
28/5/17 |
11/6/17 |
25/6/17 |
9/7/17 |
30/7/17 |
-- |
|
Public Sentiment Index (PSI) |
66.8 |
60.2 |
59.0 |
73.4 |
109.1 |
103.0 |
-6.0 |
|
Government Appraisal (GA) |
76.4 |
69.9 |
70.9 |
76.7 |
113.1 |
105.6 |
-7.5 |
|
Rating of CE |
41.7 |
38.1 |
37.6 |
38.7 |
63.7 |
58.5 |
-5.3 |
|
Net approval rate of CE |
-43% |
-53% |
-54% |
-50% |
19% |
15% |
-4% |
|
Mean value of people’s satisfaction with SARG |
2.5 |
2.4 |
2.5 |
2.6 |
2.9 |
2.7 |
-0.2 |
|
Mean value of people’s trust in SARG |
2.9 |
2.8 |
2.8 |
3.0 |
3.2 |
3.0 |
-0.2 |
|
Society Appraisal (SA) |
75.8 |
72.5 |
69.8 |
85.5 |
96.0 |
92.6 |
-3.4 |
|
People’s satisfaction with political condition |
2.0 |
2.0 |
2.0 |
2.2 |
2.3 |
2.0 |
-0.3 |
|
Weighting index of political condition |
0.30[12] |
0.30[12] |
0.30[12] |
0.30 |
0.30[12] |
0.30[12] |
-- |
|
People’s satisfaction with economic condition |
2.9 |
2.7 |
2.7 |
3.0 |
2.8 |
2.9 |
+0.1 |
|
Weighting index of economic condition |
0.34[12] |
0.34[12] |
0.34[12] |
0.34 |
0.34[12] |
0.34[12] |
-- |
|
People’s satisfaction with livelihood condition |
2.5 |
2.5 |
2.4 |
2.6 |
2.6 |
2.5 |
-0.1 |
|
Weighting index of livelihood condition |
0.35[12] |
0.35[12] |
0.35[12] |
0.36 |
0.36[12] |
0.36[12] |
-- |
[12] POP will adopt the latest published weighting index figures when there are no respective updates.
[13] Latest changes are based on the differences between the exact values of the two figures, but not the rounded figures shown in the table.
As for the meaning of the score values, please refer to the following:
|
Score value |
Percentile |
Score value |
Percentile |
|
140-200 |
Highest 1% |
0-60 |
Lowest 1% |
|
125 |
Highest 5% |
75 |
Lowest 5% |
|
120 |
Highest 10% |
80 |
Lowest 10% |
|
110 |
Highest 25% |
90 |
Lowest 25% |
|
100 being normal level, meaning half above half below |
|||
The latest PSI of 103.0 can be considered as among the best 42% across the past 20 years or so, while the GA and SA scores of 105.6 and 92.6 can be considered as among the best 35% and worst 31% respectively.
Commentary
Frank Wai-Kin Lee, Research Manager of POP, observed, “Our latest survey shows that the popularity rating of CE Carrie Lam has decreased significantly by 5.2 marks to 58.5 compared to early July. Her latest approval rate is 50%, disapproval rate 35%, giving a net popularity of positive 15 percentage points. As for the SAR Government, its popularity has not changed much compared to two weeks ago. Its satisfaction rate now stands at 35%, dissatisfaction rate 41%, giving a net satisfaction rate of negative 7 percentage points while its latest net trust stands at positive 10 percentage points. As for society’s appraisals, among economic, livelihood and political conditions, people remain to be least satisfied with the current political condition. The three net satisfactions are negative 1, negative 27 and negative 51 percentage points respectively. Indepth analysis shows that the younger and the more educated the respondents, the more critical they are of Carrie Lam as CE in terms of both support rate and rating. As for the Public Sentiment Index (PSI), the rising trend has receded in late July. The latest PSI stands at 103.0, down 6.0 points from the record high of 109.1 in early July. This time both component scores of PSI decrease. Specifically, the Government Appraisal (GA) Score that reflects people’s appraisal of society’s governance goes down by 7.5 points to 105.6, and the Society Appraisal (SA) Score that reflects people’s appraisal of the social environment decreases by 3.4 points to 92.6. As for the reasons affecting the ups and downs of these figures, we leave it to our readers to form their own judgment using detailed records displayed in our ‘Opinion Daily’.”
Future Release (Tentative)
August 8, 2017 (Tuesday) 1pm to 2pm: Ratings of top 10 cross-strait political figuresReference Materials on Survey on PSI Please refer to the HKU POP Site at http://hkupop.pori.hk.
|


