HKU POP: PSI continues to go upBack
| Press Release on January 30, 2014 | ||||||||||||||||||||||||||||||||||||||||||||||||||||||||||||||||||||||||||||||||||||||||||||||||||||||||||||||||||||||||||||||||||||||||||||||||||||||||||||||||||||||||||||
|
| Background | Latest Figures |Commentary | | ||||||||||||||||||||||||||||||||||||||||||||||||||||||||||||||||||||||||||||||||||||||||||||||||||||||||||||||||||||||||||||||||||||||||||||||||||||||||||||||||||||||||||||
The Public Sentiment Index (PSI) compiled by the Public Opinion Programme (POP) at the University of Hong Kong aims at quantifying Hong Kong people’s sentiments, in order to explain and predict the likelihood of collective behaviour. PSI comprises 2 components: one being Government Appraisal (GA) Score and the other being Society Appraisal (SA) Score. GA refers to peoples’ appraisal of society’s governance while SA refers to peoples’ appraisal of the social environment. Both GA and SA scores are compiled from a respective of 4 and 6 opinion survey figures. All PSI, GA and SA scores range between 0 to 200, with 100 meaning normal, the grading reference of the scores are shown below. For methodological detailed please refer to the HKU POP Site at http://hkupop.pori.hk. POP started to pilot study the “Public Sentiment Index” in year 2010 in collaboration with NowTV. The first survey was conducted in June 2010, followed by a series of monthly tracking surveys in 2011. There were altogether 13 surveys, covered by 11 releases from March 2011 to January 2012. All results have been uploaded to the POP Site. At the end of June 2012, before the 15th anniversary of the handover of Hong Kong, POP officially released a “PSI analysis” with figures dating back to 1992, spanning over 20 years. Moreover, the frequency of the study was set at twice a month. In October 2012, echoing the start of a new Legislative Council, POP decided to set the cut-off date of all PSI analyses at the Sunday proceeding every 15th and last day of month, whereas the release date was set at the first Thursday following the cut-off date, except under special circumstances. Cut-off date of the PSI figures released by POP today is January 26, 2014, while that of the next round of release will be February 9, 2014. The tentative release date for the next release will be February 13, 2014 (Thursday). | ||||||||||||||||||||||||||||||||||||||||||||||||||||||||||||||||||||||||||||||||||||||||||||||||||||||||||||||||||||||||||||||||||||||||||||||||||||||||||||||||||||||||||||
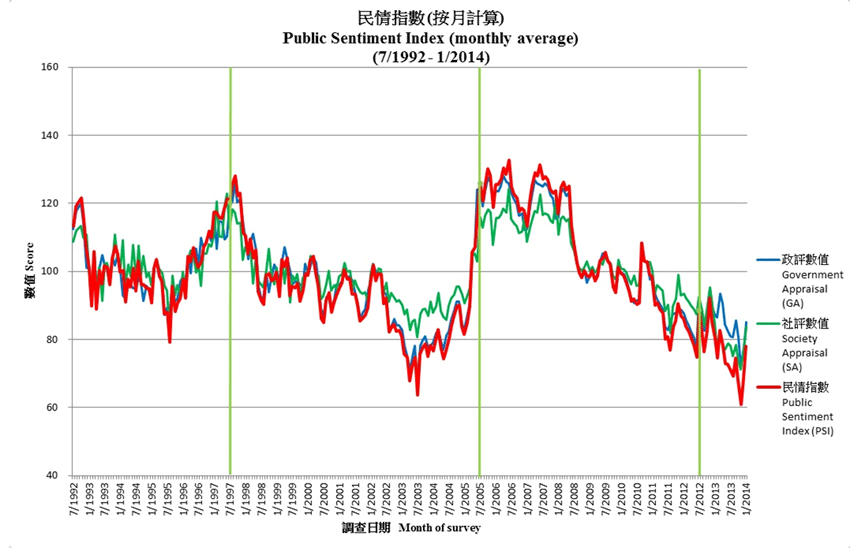
Latest Figures From 2014, POP enhanced the previous simple weighting method based on age and gender distribution to “rim weighting” based on age, gender and education (highest level attended) distribution. The latest figures released today have been rim-weighted according to provisional figures obtained from the Census and Statistics Department regarding the gender-age distribution of the Hong Kong population in mid-year 2013 and the educational attainment (highest level attended) distribution collected in the 2011 Census. The PSI released by POP today shows that as of January 26, 2014, the latest Public Sentiment Index (PSI) is 79.3, up 2.8 from early-January. As for the Government Appraisal (GA) and Society Appraisal (SA), the scores are 85.0 and 85.9, down 0.1 and up 4.2 respectively. The monthly average charts of PSI, GA and SA are shown below:
As for the meaning of the score values, please refer to the following:
The latest PSI of 79.3 can be considered as among the worst 8% across the past 20 years, while the GA and SA scores of 85.0 and 85.9 can be considered as among the worst 16% and 17% respectively. Recent values of PSI, GA, SA and 10 fundamental figures are tabulated as follows:
[1] POP will adopt the latest published weighting index figures when there are no respective updates.
Recent average PSI, GA and SA figures per month are tabulated as follows:
| ||||||||||||||||||||||||||||||||||||||||||||||||||||||||||||||||||||||||||||||||||||||||||||||||||||||||||||||||||||||||||||||||||||||||||||||||||||||||||||||||||||||||||||
Commentary Winnie Wing-Yi Lee, Research Manager of Public Opinion Programme, observed, “Hong Kong’s Public Sentiment Index continues to go up from its record low at 58.3 registered in early November 2013, to the current value of 79.3 points. Although the latest Government Appraisal (GA) score drops slightly by 0.1 points from that registered in early January to 85.0, the Society Appraisal (SA) score rises by 4.2 points to reach 85.9. In terms of monthly figures, the PSI of January 2014 stands at 77.9, which can be considered as among the worst 7% across the past 20 years. Both the GA and SA scores climb back up to the above 80 level, but they can still be considered as among the worst 16% and 14% across the past 20 years respectively. The latest figures have already covered the effect of ‘Policy Address’, which appears to have soothed public anger. As for other reasons affecting the ups and downs of these figures, we leave it to our readers to form their own judgment using detailed records displayed in the ‘Opinion Daily’ of our POP Site.” | ||||||||||||||||||||||||||||||||||||||||||||||||||||||||||||||||||||||||||||||||||||||||||||||||||||||||||||||||||||||||||||||||||||||||||||||||||||||||||||||||||||||||||||
Next PSI Release (Tentative)
| ||||||||||||||||||||||||||||||||||||||||||||||||||||||||||||||||||||||||||||||||||||||||||||||||||||||||||||||||||||||||||||||||||||||||||||||||||||||||||||||||||||||||||||
Reference Materials on Survey on PSI Please refer to the HKU POP Site at http://hkupop.pori.hk.
| ||||||||||||||||||||||||||||||||||||||||||||||||||||||||||||||||||||||||||||||||||||||||||||||||||||||||||||||||||||||||||||||||||||||||||||||||||||||||||||||||||||||||||||
|
| Background | Latest Figures |Commentary | | ||||||||||||||||||||||||||||||||||||||||||||||||||||||||||||||||||||||||||||||||||||||||||||||||||||||||||||||||||||||||||||||||||||||||||||||||||||||||||||||||||||||||||||


