Exit Polling in the 21st Century: A Perspective from the USABack
Robert TY Chung and Winnie WY Lee (Editors) |
|||||||||||||||||||||||||||||||||||||||||||||
On 15 June 2012, during the 65th Annual Conference of WAPOR (World Association of Public Opinion Research) held in Hong Kong, a special panel was hosted by WAPOR’s sister organization AAPOR (American Association of Public Opinion Research) on “Exit Polling in the 21st Century: A Perspective from the USA”. Four presentations were made, three of them were summarized and published in the August issue of Media Digest. The fourth one written by Marjorie Connelly of the New York Times is summarized in this article.
“How the New York Times Reports Exit Poll Findings” Marjorie Connelly, The New York Times, USA
About the author Marjorie Connelly is an editor in News Surveys, the department that designs, conducts, and analyzes public opinion polls for The Times. She works on questionnaire development, data analysis, and survey interpretation. In addition to working jointly with reporters and editors and developing graphics, she often writes stories based on polls. She analyzes and interprets Election Day polls to create graphics, known as Portrait of the Electorate. For more articles by Connelly, please check out the New York Times website at www.nytimes.com/politics.
National Election Day Exit Polls The New York Times has used exit polls since it first joined forces with CBS News in 1976. CBS News conducted its first national exit poll in 1972, then with The Times did national and state exit polls until 1990 when the television networks created a consortium to conduct the exit polls. Exit polls are now handled by the National Election Pool, or the NEP, comprising major American television networks – ABC News, CBS News, CNN, the Fox News Channel and NBC News - along with the Associated Press. Representatives from these companies determine what states will be surveyed and what questions will be asked. Other media outlets like The New York Times are known as subscribers.
Table: USA national exit polls archived at the Roper Center at the University of Connecticut
The National Election Pool The National Election Pool – or the NEP - is made up of the news departments of the major American television networks – ABC News, CBS News, CNN, the Fox News Channel and NBC News - along with the Associated Press. Representatives from these companies determine what states will be surveyed and what questions will be asked. Other media outlets -- including The New York Times - are known as subscribers.
A Selection of Subscribers to the NEP Exit Polls Subscribers pay substantially less money and have no input into the process, for instance, what states are surveyed or what questions are included on the poll. The Times gets access to the data later in the day and are limited in how many state polls it can purchase. Subscribers are generally newspapers and local television stations. It generally buys as many as it is allowed – usually that is 15 primary state exit polls and 15 states for the general election, plus our local market – in our case that’s New York, New Jersey and Connecticut - and the national exit poll.
Exit Poll Use Although The Times no longer has a seat at the table when it comes to writing the questionnaire, its use of exit polls has not changed much since 1976, except online presentations.
On the night of the election or primary or caucus, there are usually several articles. Exit poll solves the problem of what to say in the early editions after an election. The main story is an overview of the election, it generally has just a few paragraphs based on exit polls. Sometimes it publishes a separate exit poll story.
On the election night, whether in primary, caucus or the general election, The Times does not use exact percentages. The exit polls change throughout the evening as additional questionnaires are entered into the system and actual vote results become available and specific numbers are very likely to change many times throughout the night. So the article will say almost half, or 4 in 10 or about two-thirds. It does check the stories during the evening after every re-weighting of the exit poll before each edition closes to see if a percentage has changed enough so that, for example, almost half should be altered to read about 4 in10 or almost 6 in 10. But it does not use actual percentages until it has been told by Edison that the data has received its final weight, which it would generally be the next day.
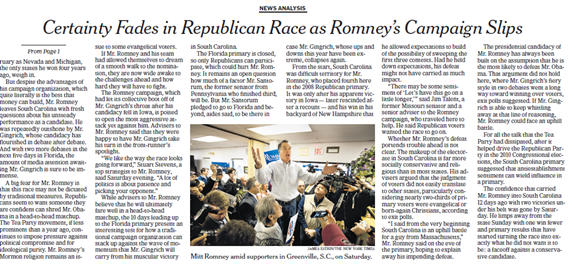
In addition to the main election story, there is often a second story called internally -- assess. Where the main election article is a straightforward news story, assess is an analytical piece. Depending on the writer, it may include exit poll data. Sometimes, in addition to using exit poll data in the main story and the assess article, the Times will publish a separate exit poll story. When there was no individual exit poll story, the exit poll results were fused into the main article.
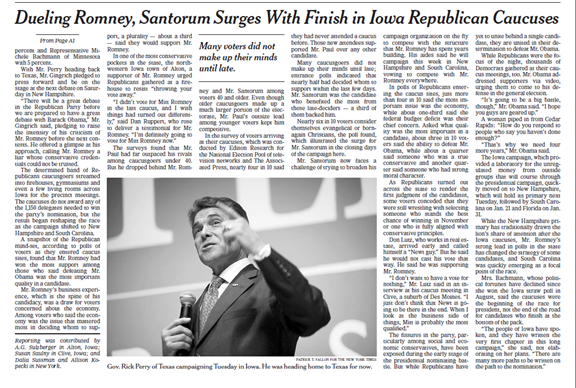
Besides the main political correspondents, The Times has reporters covering the candidates. They may use exit poll data on election night or in their daily campaign stories. Furthermore, exit poll data will be used to inform profiles of a candidate over the years and also about particular issues using exit poll results.
There a few demographics groups that seems to be of perennial interest – such as Hispanics, evangelical Christians, blue collar voters. An article in 1982 discussed the blue collar vote for Ronald Reagan. In 1988 exit polls in some primary states were examined for Jesse Jackson’s standing with Hispanic voters. In 2000, an article reviewing religious conservative backing for Republican presidential candidates was informed by exit polls. And again during the primary season this year in 2012, articles were written about these voters with the assistance of exit poll results.
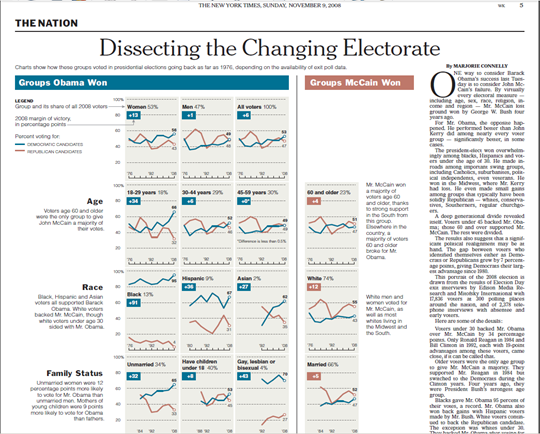
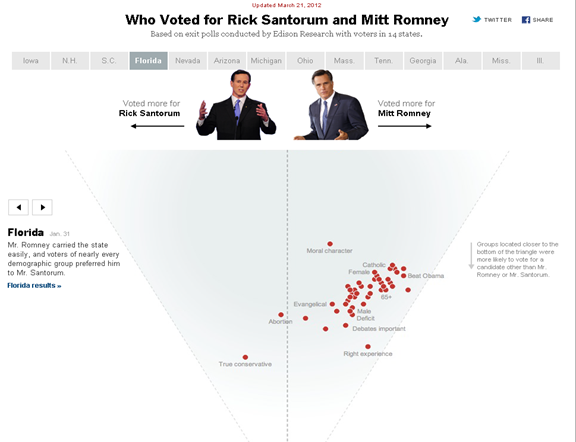
Graphics In addition to using exit poll results in articles, in illustrative graphics and in blog posts, there has been a popular tradition at The Times that uses exit poll data on a grand scale, generally called the portrait of the electorate, now comprising a series of fever charts. In 2008, this graphic won a silver award at an annual information graphics competition conducted by the Society for News Design. Since then, a more interactive version has been created.
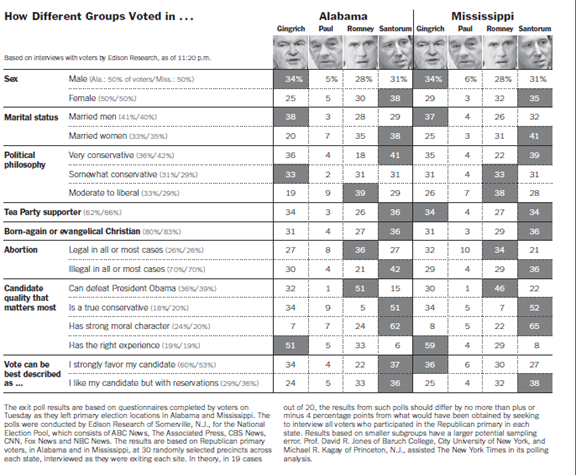
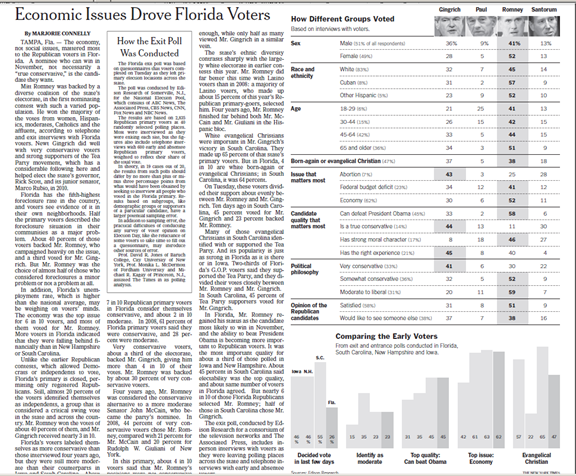
A number of years ago, The Times only used vertical percentages on election night, in case the race hadn’t been called, because it didn’t want the graphic to indicate a particular candidate’s strength based on polling. Then the day after the primary or caucus, a graphic using horizontal numbers would be published. Nowadays, it just publishes the horizontal crosstabs on election nights, generally a Wednesday paper. One reason for this change is the development of the internet, as by the time Thursday’s paper comes out, the horizontal numbers have been all over the web and they will be old news by then. It still uses exit poll results in graphics often after election night but to illustrate a particular candidate story or an issue article.
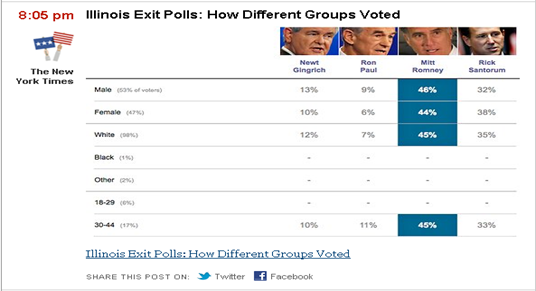
This is an example of the print graphics published this primary season. When there is no exit poll story, the material comparable to the method box is used as the footnote for the graphic. As the data changes during the evening, the graphics will be updated before each edition closes.
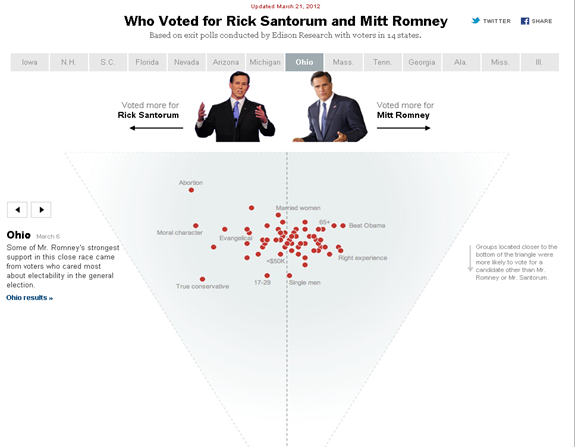
The graphics that appear online on election night are similar to the ones in print, only that the online version is bigger, as there are no space constraints online that exist in the print version of the paper. These online graphics also appear in color.
The New York Times website does not publish all the results, because it actually is contractually prohibited from doing that, nonetheless, it includes most of the questions by all the candidates. A graphics editor sets it up so the data feeds in directly from the Edison website. The same system is used to create the print graphic. So it no longer has to enter the numbers in by hand. Each time the exit poll changes in anyway, there will be more cases entered or a reweighting, these graphics can updated online fairly quickly.
The author, Marjorie Connelly, is an editor in News Surveys, the department that designs, conducts, and analyzes public opinion polls for The Times. She works on questionnaire development, data analysis, and survey interpretation. In addition to working jointly with reporters and editors and developing graphics, she often writes stories based on polls. She analyzes and interprets Election Day polls to create graphics, known as Portrait of the Electorate. For more articles by Connelly, please check out the New York Times website at www.nytimes.com/politics.
Additional graphics for Mayella to select:
|
|||||||||||||||||||||||||||||||||||||||||||||