Summary of FindingsBack
The first part of the survey was to study the general public's perception of the local universities, namely, The Chinese University of Hong Kong (CUHK), The City University of Hong Kong (CityU), The Hong Kong Baptist University (HKBU), The Hong Kong Institute of Education (HKIEd), The Hong Kong University of Science and Technology (HKUST), The Lingnan University (Lingnan), The Polytechnic University of Hong Kong (PolyU) and The University of Hong Kong (HKU), order rotated in different questionnaires. By means of a rating scale from 0-10, with 0 representing the worst, 10 representing the best and 5 being half-half, these universities were assessed one by one with regard to their overall performance plus three core attributes selected by the researcher and the client. | |
In order to eliminate possible bias due to ordering, the sequence of rating the eight universities was randomly rotated across all rating questions. | |
First of all, all respondents were asked to evaluate each of these local universities based on their perception of its overall performance using a scale of 0-10, with 0 representing the worst, 10 representing the best and 5 being half-half. Respondents were suggested to take into account the university's local and international reputation, facilities, campus environment, qualification of its teaching staff, academic research performance, conduct and quality of its students, its learning atmosphere, as well as the diversification and degree of recognition for its courses. Survey results indicated that, in terms of public perception, HKU received the highest mean score of 7.89 as rated by 746 respondents, CUHK came 2nd with an average score of 7.55 rated by 747 respondents, whereas HKUST ranked 3rd with a mean score of 7.14 rated by 694 respondents. When compared to the findings of a similar survey conducted last year, regarding the overall performance of the eight universities being assessed, no significant differences were observed in terms of their respective rankings and mean scores (Table 3). | |
| 2003 Survey | 2002 Survey | |||||||
| Average | Standard error | No. of raters | Recognition(No. of raters/ total sample) | Average | Standard error | No. of raters | Recognition(No. of raters/ total sample) | |
| 1. HKU | 7.89 | 0.05 | 746 | 72.8% | 7.87 | 0.05 | 728 | 70.7% |
| 2. CUHK | 7.55 | 0.05 | 747 | 72.9% | 7.53 | 0.05 | 725 | 70.5% |
| 3. HKUST | 7.14 | 0.05 | 694 | 67.7% | 7.16 | 0.06 | 685 | 66.6% |
| 4. PolyU | 6.83 | 0.05 | 720 | 70.2% | 6.78 | 0.05 | 698 | 67.8% |
| 5. HKBU | 6.31 | 0.05 | 682 | 66.5% | 6.21 | 0.05 | 679 | 66.0% |
| 6. CityU | 6.04 | 0.05 | 660 | 64.4% | 6.10 | 0.06 | 659 | 64.0% |
| 7. HKIEd | 5.82 | 0.06 | 601 | 58.6% | 5.83 | 0.06 | 604 | 58.7% |
| 8. Lingnan | 5.57 | 0.06 | 633 | 61.8% | 5.44 | 0.06 | 619 | 60.2% |
B. Transparency in Dealing with Internal and External Parties | |
With respect to the perceived transparency of each university when carrying out new policies and reforms, taking into consideration its performance in consulting its students and staff, releasing information to the mass media, as well as explaining itself to the public and collecting public opinions, HKU again received the highest rating with a mean score of 6.63 rated by 635 respondents, followed closely by CUHK with an average score of 6.59 from 626 respondents, forming the first tier in terms of their perceived transparency. The 3rd and 4th ranks, which comprised the next tier, fell to HKUST (6.25) and PolyU (6.23) respectively. When compared to the findings obtained in the 2002 survey, the respective rankings of HKBU and CityU have swapped this year, while an increase of 0.26 mark was recorded for the mean score of Lingnan, which was tested to be statistically significant at p=0.01 level, indicating an obvious enhancement in its transparency as perceived by the general public (Table 4). | |
| 2003 Survey | 2002 Survey | |||||||
| Average | Standard error | No. of raters | Recognition(No. of raters/ total sample) | Average | Standard error | No. of raters | Recognition(No. of raters/ total sample) | |
| 1. HKU | 6.63 | 0.07 | 635 | 62.0% | 6.64 | 0.07 | 546 | 53.1% |
| 2. CUHK | 6.59 | 0.07 | 626 | 61.1% | 6.60 | 0.07 | 546 | 53.1% |
| 3. HKUST | 6.25 | 0.07 | 595 | 58.0% | 6.29 | 0.07 | 514 | 50.0% |
| 4. PolyU | 6.23 | 0.06 | 599 | 58.4% | 6.17 | 0.07 | 514 | 50.0% |
| 5. HKBU | 5.90 | 0.06 | 576 | 56.2% | 5.81 | 0.07 | 499 | 48.5% |
| 6. CityU | 5.84 | 0.06 | 575 | 56.1% | 5.82 | 0.07 | 504 | 49.0% |
| 7. HKIEd | 5.60 | 0.07 | 523 | 51.0% | 5.59 | 0.08 | 460 | 44.7% |
| 8. Lingnan | 5.58** | 0.07 | 547 | 53.4% | 5.32 | 0.08 | 477 | 46.4% |
Regarding the perceived contribution made to society by each university's teaching staff, taking into account their academic research performance, efforts in promoting their university's image and upgrading its international ranking, participation in community services, as well as their response and commitment to the needs of society, HKU again received the highest mean score of 7.26 rated by 661 respondents, followed by CUHK at 7.12 from 651 raters and then HKUST at 6.82 rated by 626 respondents. The overall rankings stayed practically unchanged when compared to last year's survey, whereas a significant increase of 0.19 mark was registered for the mean score of Lingnan (Table 5). | |
| 2003 Survey | 2002 Survey | |||||||
| Average | Standard error | No. of raters | Recognition(No. of raters/ total sample) | Average | Standard error | No. of raters | Recognition(No. of raters/ total sample) | |
| 1. HKU | 7.26 | 0.06 | 661 | 64.5% | 7.28 | 0.06 | 596 | 57.9% |
| 2. CUHK | 7.12 | 0.06 | 651 | 63.5% | 7.17 | 0.06 | 599 | 58.2% |
| 3. HKUST | 6.82 | 0.07 | 626 | 61.1% | 6.90 | 0.07 | 565 | 54.9% |
| 4. PolyU | 6.57 | 0.06 | 625 | 61.0% | 6.51 | 0.07 | 569 | 55.3% |
| 5. HKBU | 6.09 | 0.06 | 595 | 58.0% | 6.07 | 0.07 | 556 | 54.0% |
| 6. CityU | 6.00 | 0.06 | 601 | 58.6% | 5.96 | 0.07 | 549 | 53.4% |
| 7. HKIEd | 5.90 | 0.07 | 561 | 54.7% | 5.86 | 0.08 | 527 | 51.2% |
| 8. Lingnan | 5.66* | 0.07 | 562 | 54.8% | 5.47 | 0.07 | 514 | 50.0% |
The last question rated in this part of the survey was the perceived overall performance of the Vice-Chancellor/President of each university, taking into consideration one's local and international reputation, approachability, leadership, vision, social credibility and public relations. It is worthy mentioning that the recognition rates for six out of eight current Vice-Chancellors/ Presidents rated in this year's survey were over 50% (ranging from 52% to 58%). In this aspect, Professor Paul C.W. Chu of HKUST topped the list for two consecutive years, with an average score of 7.22 rated by 597 respondents, while Professor Lap-chee Tsui of HKU and Professor Ambrose Y.C. King of CUHK came 2nd and 3rd, with mean scores of 7.16 (rated by 566 respondents) and 6.87 (rated by 528 respondents) respectively. The 4th to 8th ranks fell to the Vice-Chancellors/Presidents of PolyU, Lingnan, HKBU, CityU and HKIEd correspondingly, with their average scores ranging from 6.64 to 6.07 (Table 6). | |
| 2003 Survey | 2002 Survey | |||||||
| Average | Standard error | No. of raters | Recognition(No. of raters/ total sample) | Average | Standard error | No. of raters | Recognition(No. of raters/ total sample) | |
| 1. HKUST - Paul C.W. CHU | 7.22 | 0.06 | 597 | 58.2% | 7.26 | 0.07 | 495 | 48.1% |
| 2. HKU - Lap-chee TSUI# | 7.16 | 0.06 | 566 | 55.2% | -Not applicable- | |||
| 3. CUHK - Ambrose Y.C. KING# | 6.87 | 0.06 | 528 | 51.5% | -Not applicable- | |||
| 4. PolyU - Chung-kwong POON | 6.64 | 0.06 | 541 | 52.8% | 6.56 | 0.07 | 459 | 44.6% |
| 5. Lingnan - Edward K.Y. CHEN | 6.48 | 0.07 | 590 | 57.6% | 6.48 | 0.07 | 480 | 46.6% |
| 6. HKBU - Ching-fai NG | 6.33 | 0.06 | 531 | 51.8% | 6.31 | 0.07 | 447 | 43.4% |
| 7. CityU - H.K. CHANG | 6.18 | 0.07 | 488 | 47.6% | 6.31 | 0.07 | 415 | 40.3% |
| 8. HKIEd - Paul MORRIS# | 6.07 | 0.07 | 430 | 42.0% | -Not applicable- | |||
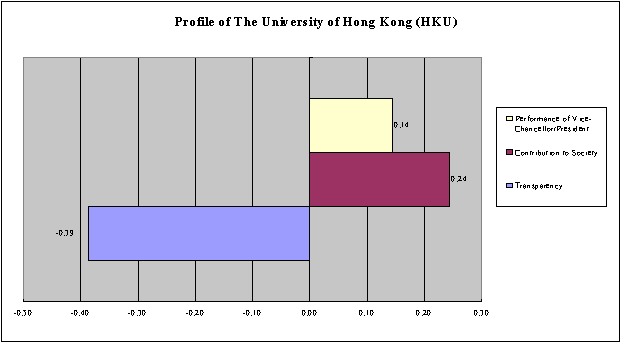
As a collective analysis, the average scores attained by each university regarding three of the above attributes (excluding the overall performance ratings of the universities) were used to produce a relative strength-and-weakness profile. | |
As shown from Charts 1 to 8 (in alphabetical order of universities), all attributes with a positive value (presented on the right side of the chart) represent the relative strengths of each university in terms of the three attributes measured. Conversely, negative attributes (on the left of the chart) refer to their relative weaknesses. And the value next to each bar denotes the net difference between the average score of that particular attribute and the overall average of the three attributes obtained by each university. However, since the list of attributes measured in this survey is far from comprehensive (only three, even after including the performance of their Vice-Chancellors/Presidents into the analysis), the profiles shown here would not be able to reflect the strengths and weaknesses of each institution comprehensively. They are included here just to demonstrate one approach to make sense of the data collected, using a framework developed in the similar surveys conducted in the past two years. | |
As a general observation, among the three attributes measured, similar to last year's survey, transparency has remained to be a relatively poor attribute for all universities assessed. For BU, CityU and Lingnan, the performance of their Presidents stands out to be relatively strong among the three attributes. Overall speaking, the patterns of the relative strength-and-weakness profile of the eight universities have remained more or less the same as those of 2002, except that the performance of HKU's Vice-Chancellor has become its positive asset this year, as opposed to last year's result. | |
Chart 1

Chart 2

Chart 3

Chart 4
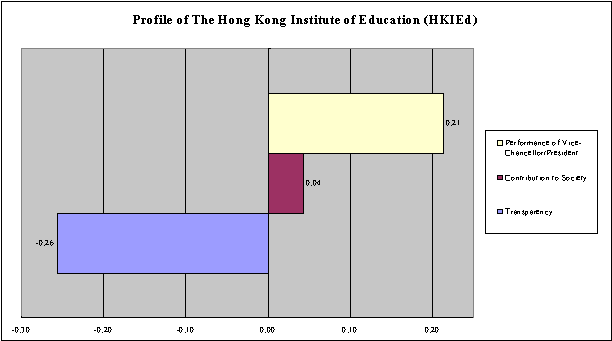
Chart 5
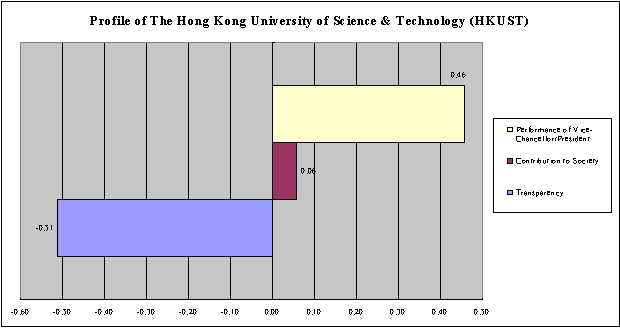
Chart 6
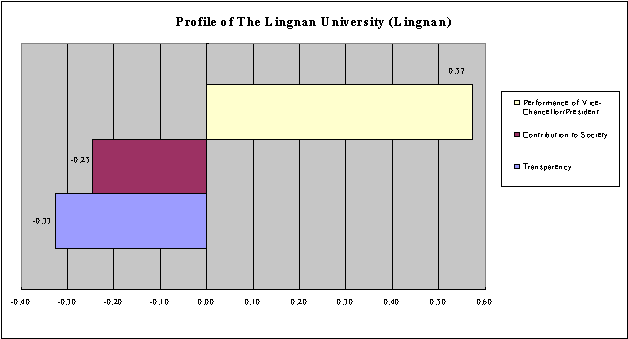
Chart 7
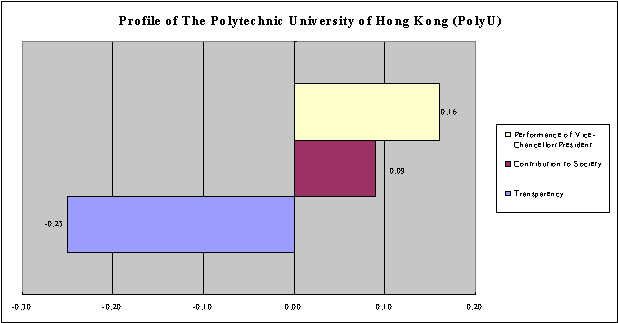
Chart 8
A new question has been added to this year's survey to gauge respondents' opinion on the qualities which most Hong Kong university graduates lack of. Results showed that, without prompting, 29% of the respondents failed to provide a definite answer. "Proficiency in Chinese, English and Putonghua" and "work attitude" were most frequently mentioned, by 19% and 17% of the total sample respectively. Meanwhile, "academic and professional knowledge", "social skills/interpersonal skills" and "critical thinking and problem-solving ability" were also commonly cited, each by 10% of the total sample (Table 7). | |
| Frequency | % of total responses (Base = 1,392 responses from 1,008 respondents) | % of total sample (Base = 1,025) | |
| Proficiency in Chinese, English and Putonghua | 190 | 13.7% | 18.5% |
| Work attitude (e.g. serious, enthusiastic, diligent, responsible, motivated) | 171 | 12.3% | 16.7% |
| Academic and professional knowledge | 102 | 7.3% | 10.0% |
| Social skills / interpersonal skills | 98 | 7.1% | 9.6% |
| Critical thinking and problem-solving ability | 98 | 7.0% | 9.6% |
| Work experience | 90 | 6.5% | 8.8% |
| Conduct, honesty | 86 | 6.1% | 8.4% |
| Communication skills | 38 | 2.8% | 3.7% |
| Self-confidence | 36 | 2.6% | 3.5% |
| Commitment to society | 33 | 2.4% | 3.2% |
| Global prospect / foresight | 23 | 1.7% | 2.2% |
| Emotion stability | 17 | 1.2% | 1.7% |
| Creativity | 14 | 1.0% | 1.4% |
| Computer proficiency | 4 | 0.3% | 0.4% |
| Others | 92 | 6.6% | 9.0% |
| Don't know/ hard to say | 299 | 21.5% | 29.2% |
| Total | 1,392 | 100.0% | |
| Base | 1,008 | ||
| Missing case(s) | 17 |
Another new question was included in this year's survey to measure the perceived demand for other local private institutions or external courses offered by overseas universities. The findings revealed that 45% of the respondents considered such demand to be high, as opposed to 21% who thought it was low. Meanwhile, 23% of the respondents did not provide a definite answer to this question (Table 8). | |
| Frequency | Percentage | |
| High | 457 | 44.8% |
| Half-half | 115 | 11.2% |
| Low | 215 | 21.1% |
| Don't know / hard to say | 233 | 22.9% |
| Total | 1,019 | 100.0% |
| Base | 1,025 | |
| Missing case(s) | 6 |
The survey went on to study employers' preference when selecting university graduates. To begin with, all respondents were asked if they were involved in any recruitment process of new staff in performing their office duties. Results showed that 19% of the total sample had such authority in one way or another (Table 9). | |
Among these respondents, only 18% (i.e. 3% of total sample) had recruited university graduates via university career or counseling centers, which was similar to that of last year's survey (Table 10). These respondents were further asked which university graduates they would prefer most when they looked for a new employee. Graduates of HKU topped the list again this year, as chosen by 24% of these potential employers. On the other hand, graduates from CUHK, PolyU and HKUST were preferred by 15%, 12% and 11% of this sub-sample respectively. Meanwhile, 19% of these respondents said they had no particular preference (Table 11). It should be noted, however, that because of the small sub-sample base for this question, the sampling error could be as high as 3.6 percentage points. That means at 95% confidence level, the sampling error of percentage figures for this question could be as high as plus/minus 7.2 percentage points, or plus/minus 1.3 percentage points for figures expressed as percentages of the total sample. | |
When these respondents were further asked to provide the reasons for their choices, "good performance of previous graduates" was most commonly cited (31% of sub-sample, or 5% of the total sample). Another 16% (2% of the total sample) thought the graduates of their chosen university were well-equipped with job-related knowledge, whilst 12% (2% of the total sample) preferred certain graduates simply due to the reputation of their university. Other than these, reasons like "good language ability", "good work attitude" and "diligent, motivated" were mentioned by relatively fewer respondents. These results were fairly similar to those obtained last year (Table 12). | |
| 2003 Survey | 2002 Survey | |||
| Frequency | Percentage | Frequency | Percentage | |
| Yes | 192 | 18.9% | 184 | 17.9% |
| No | 825 | 81.1% | 842 | 82.1% |
| Total | 1,017 | 100.0% | 1,026 | 100.0% |
| Base | 1,025 | 1,029 | ||
| Missing case(s) | 8 | 3 | ||
| 2003 Survey | 2002 Survey | |||||
| Frequency | Percentage | % of total sample(Base = 1,025) | Frequency | Percentage | % of total sample(Base = 1,029) | |
| Yes | 35 | 18.3% | 3.4% | 25 | 13.4% | 2.4% |
| No | 157 | 81.7% | 15.3% | 159 | 86.6% | 15.5% |
| Total | 192 | 100.0% | 184 | 100.0% | ||
| Base | 192 | 184 | ||||
| Missing case(s) | 0 | 0 | ||||
| 2003 Survey | 2002 Survey | |||||
| Frequency | Percentage | % of total sample(Base = 1,025) | Frequency | Percentage | % of total sample(Base = 1,029) | |
| HKU | 44 | 23.5% | 4.3% | 44 | 24.0% | 4.3% |
| CUHK | 27 | 14.5% | 2.6% | 34 | 18.7% | 3.3% |
| PolyU | 23 | 12.0% | 2.2% | 11 | 6.2% | 1.1% |
| HKUST | 20 | 10.8% | 2.0% | 21 | 11.7% | 2.0% |
| HKBU | 6 | 2.9% | 0.6% | 5 | 2.6% | 0.5% |
| Lingnan | 4 | 2.0% | 0.4%* | 0 | 0.0% | 0.0% |
| CityU | 1 | 0.7% | 0.1% | 6 | 3.0% | 0.6% |
| HKIEd | 0 | 0.0% | 0.0 | 2 | 1.1% | 0.2% |
| Other overseas universities | 3 | 1.6% | 0.3% | 2 | 1.3% | 0.2% |
| Others (please specify) | 2 | 1.3% | 0.2% | 1 | 0.6% | 0.1% |
| Don't know / hard to say | 22 | 11.8% | 2.1% | 20 | 10.7% | 1.9% |
| No preference | 36 | 18.9% | 3.5% | 36 | 19.9% | 3.5% |
| Total | 189 | 100.0% | 183 | 100.0% | ||
| Base | 192 | 184 | ||||
| Missing case(s) | 3 | 1 | ||||
| 2003 Survey | 2002 Survey | |||||
| Frequency | Percentage | % of total sample(Base = 1,025) | Frequency | Percentage | % of total sample(Base = 1,029) | |
| Good performance of previous graduates | 51 | 31.0% | 5.0% | 68 | 37.8% | 6.6% |
| Good knowledge in job-related areas | 25 | 15.6% | 2.4% | 26 | 14.4% | 2.5% |
| Reputation | 20 | 12.3% | 2.0% | 21 | 11.8% | 2.0% |
| Good language ability | 14 | 8.6% | 1.4% | 10 | 5.8% | 1.0% |
| Good work attitude | 12 | 7.2% | 1.2% | 12 | 6.5% | 1.2% |
| Diligent, motivated | 11 | 6.7% | 1.1% | 12 | 6.5% | 1.2% |
| Alumni | 7 | 4.0% | 0.7% | 7 | 3.8% | 0.7% |
| Good connection with outside (e.g., a university's extensive connection with enterprises, companies, or industrial firms; large number of graduates) | 3 | 2.0% | 0.3% | 6 | 3.1% | 0.6% |
| Good social relationship | 3 | 1.9% | 0.3% | 5 | 3.0% | 0.5% |
| Good leadership | 1 | 0.6% | 0.1% | 4 | 2.3% | 0.4% |
| Salary matched ability | 0 | 0.0% | 0.0% | 1 | 0.5% | 0.1% |
| Others (please specify) | 14 | 8.4% | 1.4% | 6 | 3.2% | 0.6% |
| Don't know / hard to say | 3 | 1.7% | 0.3% | 2 | 1.2% | 0.2% |
| Total | 163 | 100.0% | 178 | 100.0% | ||
| Base | 192 | 184 | ||||
| Missing case(s) | 64 | 6 | ||||
The last part of this survey was set to study the preference of this group of potential employers when making a one-in-two choice between the Hong Kong and the Mainland university graduates. Among the 192 respondents with involvement in any recruitment process, over half (55% of the sub-sample, or 10% of the total sample) of them would choose the Hong Kong graduates over the Mainland ones (16% of the sub-sample, or 3% of the total sample). Meanwhile, another 18% of these respondents expressed no particular preference (3% of the total sample, Table 13). Again, due to the smaller sub-sample size for this question, the sampling error of the percentage figures has increased accordingly, to 3.6 percentage points. | |
When further asked to give explanations for their preference for Hong Kong graduates, the most frequently cited answer was "preference for HongKonger", by 43% of these respondents (6% of the total sample), followed by "better job-related knowledge" and "more able to bear a global prospect", mentioned by 12% and 11% of the sub-sample respectively (each accounted for 2% of the total sample respectively, Table 14). | |
By the same token, as for the 30 respondents who opted for Mainland graduates, the major reason was that such graduates were "more diligent and motivated" (36% of the sub-sample, or 2% of the total sample). Another 23% (1% of the total sample) in this sub-group opted for "better work attitude", while 11% preferred Mainland graduates because of their "better language ability and higher Putonghua proficiency" (1% of the total sample, Table 15). | |
| Frequency | Percentage | % of total sample (Base = 1,025) | |
| Hong Kong Graduates | 105 | 55.0% | 10.2% |
| Mainland Graduates | 30 | 15.5% | 2.9% |
| Don't know / hard to say | 23 | 11.9% | 2.2% |
| No preference | 34 | 17.7% | 3.3% |
| Total | 192 | 100.0% | |
| Base | 192 | ||
| Missing case(s) | 0 |
| Frequency | % of total responses (Base = 137 responses from 104 respondents) | % of total sample (Base = 1,025) | |
| Preference for "HongKonger" | 59 | 43.0% | 5.8% |
| Better job-related knowledge | 17 | 12.3% | 1.7% |
| More able to bear a global prospect | 15 | 11.0% | 1.5% |
| Higher English proficiency | 12 | 8.5% | 1.2% |
| More familiar with the Hong Kong situation | 9 | 6.4% | 0.9% |
| Better work attitude | 8 | 5.6% | 0.8% |
| More diligent and motivated | 4 | 2.7% | 0.4% |
| Others | 13 | 9.7% | 1.3% |
| Don't know / hard to say | 1 | 0.8% | 0.1% |
| Total | 137 | 100.0% | |
| Base | 105 | ||
| Missing case(s) | 1 |
| Frequency | % of total responses (Base = 53 responses from 30 respondents) | % of total sample (Base = 1,025) | |
| More diligent and motivated | 19 | 36.1% | 1.9% |
| Better work attitude | 12 | 23.0% | 1.2% |
| Better language ability and higher Putonghua proficiency | 6 | 11.6% | 0.6% |
| Better performance than Hong Kong graduates | 5 | 8.9% | 0.5% |
| Lower salary | 3 | 6.4% | 0.3% |
| Better job-related knowledge | 1 | 2.2% | 0.1% |
| More familiar with the Mainland situation | 1 | 2.0% | 0.1% |
| Deserves giving a chance to | 1 | 1.9% | 0.1% |
| Others | 4 | 8.0% | 0.4% |
| Don't know / hard to say | 0 | 0.0% | 0.0% |
| Total | 53 | 100.0% | |
| Base | 30 | ||
| Missing case(s) | 0 |


