Research Findings返回
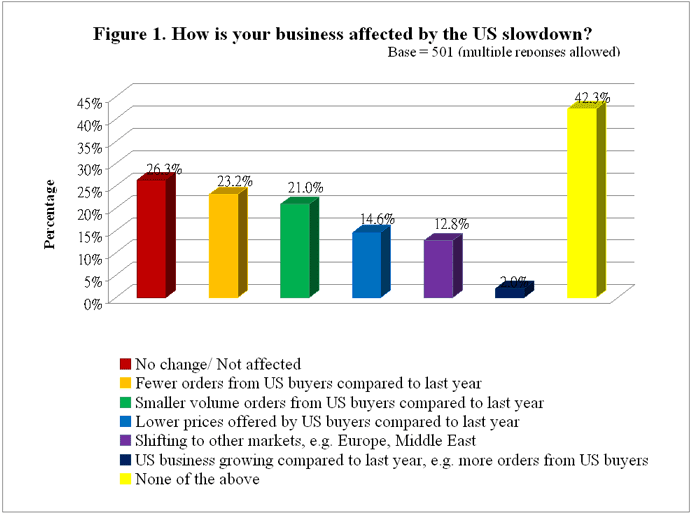
This survey comprised 6 simple opinion questions and ended by mapping some basic demographics of the company/respondent. The key findings of these questions are summarized below. Cross-references could be made with the tables in Appendix 2. Business affected by the US slowdown The survey began by asking the respondents how their businesses were affected by the US slowdown. 26% of the SMEs interviewed claimed that their businesses were "not affected "or had "no change". 23% reported that they received "fewer orders from US buyers compared to last year" while 21% said they received "smaller volume orders from US buyers compared to last year". A respective of 15% and 13% of the SMEs interviewed claimed "lower prices offered by US buyers compared to last year" and "shifted to other markets". Only a small proportion claimed that their "US business growing compared to last year" (2%). Meanwhile, 42% reported that none of the aforementioned situations had happened to their businesses, most probably due to the fact that their businesses were un-related to the US market (Table 3). See Figure 1.
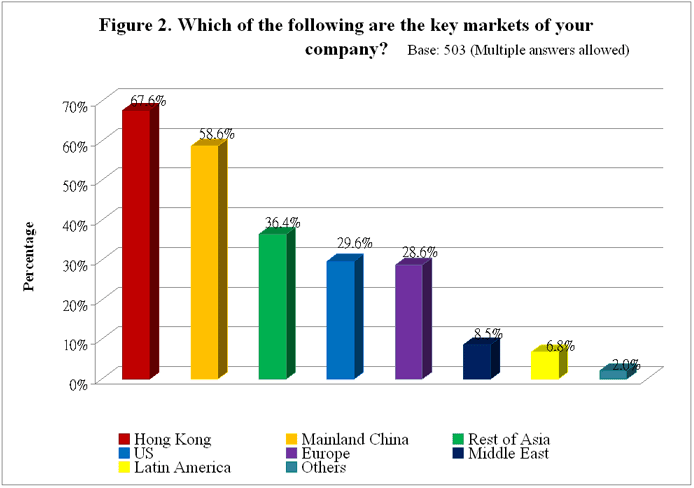
Among the 503 valid cases, majority reported that Hong Kong (68%) was their key market and Mainland China (59%) came next. While 36% reported that "Rest of Asia" was their key markets, a respective of 30% and 29% of the SMEs interviewed claimed that the US and Europe were their key markets. Followed at a distance, less than 10% of the SMEs said Middle East (9%) and Latin America (7%) were their key markets (Table 4). See Figure 2.
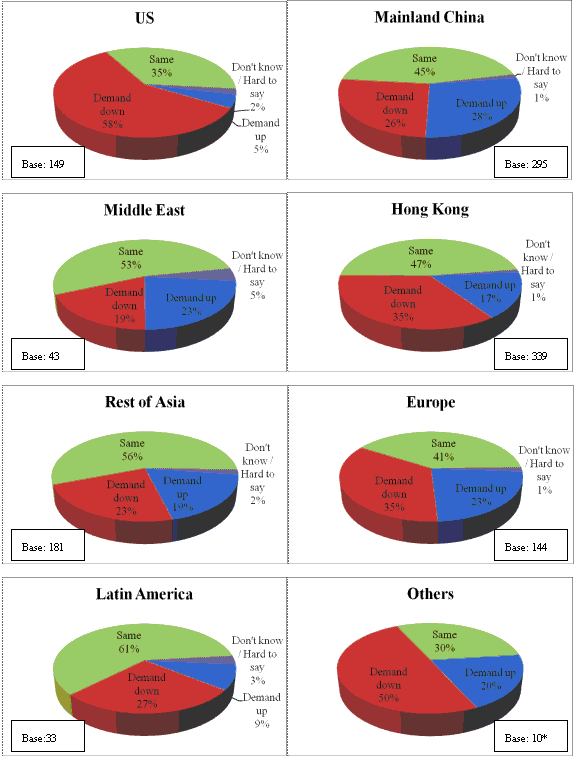
When comparing the demand now from their key markets to that of 12 months ago, opinions of companies with different key markets varied. Majority of the SMEs with key market in the US reported "demand down" (58%), while 35% reported "same" and only 5% reported "demand up". On the other hand, among the SMEs with key markets in other mentioned countries, at least 40% in the sub-samples reported that the demand from their key markets was the "same" as that of 12 months ago. Except for Mainland China and Middle East, higher proportions of the sub-samples claimed "demand down" than those claimed "demand up" (Table 5). See Figure 3. Figure 3. How is demand from your key markets now compared to 12 months ago?
* As the sub-sample is less than 30, while the smaller the sample size, the larger the sampling error. Findings for this part should therefore be treated as rough reference only. Concern about buyers' credit quality and remedies When asked if they are concerned about buyers' credit quality in the current environment, more than half (55%) of the SMEs interviewed said "No" whereas 43% admitted that they were concerned about it (Table 6). See Figure 4.
With regard to the risk management strategies towards non-payment buyers, 40% of the SMEs interviewed had used "less open account trade", which topped the list. While 31% reported that they were not doing anything about it, 28% said they made "greater use of trade services provided by banks". Those reported "doing less business in that market" and "use of export credit insurance" both accounted for 17% of the sample, and 13% reported "accepting smaller orders to reduce transaction size" (Table 7). See Figure 5.
Result also revealed that 45% of the SMEs interviewed claimed they were not doing anything to increase their companies' cost efficiency. On the contrary, 30% reported they had been "changing suppliers" for their logistic support, banks and insurers, etc. to save some costs, which was the most commonly adopted strategy. While 18% opted for "reducing staff", 16%, 15% and 13% reported "contracting work out to cheaper location", "relocating to less expensive area in Hong Kong" and "moving own factories to cheaper locations" correspondingly. At the same time, 9% claimed that they were increasing cost efficiency by "moving to home office to save on commercial rent" (Table 8). See Figure 6.
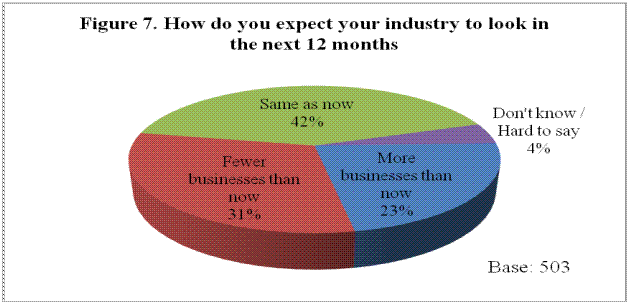
Expectation of their industries to look in the next 12 months At last, all respondents were asked how they would foresee their industries to look in the next 12 months and the results showed that 42% expected "same as now", 31% expected 『fewer businesses" while 23% expected "more businesses" (Table 9). Opinions were rather divided in this regard. See Figure 7.
|


