Summary of Findings返回
Preamble | |
The Public Opinion Programme (POP) was established in June 1991 at the Social Sciences Research Centre in The University of Hong Kong to collect and study public opinion on topics which could be of interest and value to academics, policy-makers, the media, and the general public. POP was transferred to the Journalism and Media Studies Centre (JMSC) in The University of Hong Kong effective from May 2000. In the past many years, POP has provided service to many local and overseas organizations, on the condition that POP has the right to design and conduct our studies independently, and that the results would be released for public consumption. | |
In March 2001, Media Education Info-tech Co. Ltd. (which owns "Education 18.com") commissioned the POP Team to conduct a survey on the public's perceptions of the eight universities in Hong Kong. A similar survey was carried out last year, which was designed and coordinated entirely by the client, but with a different methodology. Any comparison between the results obtained from these two surveys are not recommended. | |
The Questionnaire used in this survey was designed by the POP Team in consultation with the client, while fieldwork was designed and conducted entirely by the POP Team. Data analysis and interpretation were also carried out independently by the POP Team. | |
Summary of Findings | |
The first part of the survey investigated people's general perceptions of the eight local universities, namely, The Baptist University (BU), The City University of Hong Kong (CityU), The Chinese University of Hong Kong (CUHK), The Hong Kong Institute of Education (HKIEd), The Lingnan University (Lingnan), The Polytechnic University of Hong Kong (PolyU), The University of Hong Kong (HKU) and The University of Science and Technology (UST), in alphabetical order. By means of a rating scale from 0-10, with 0 representing the worst, 10 representing the best and 5 being half-half, these universities were assessed one by one with regard to six core attributes selected by the researcher. | |
In order to eliminate possible bias due to ordering, the sequence of rating the eight universities was randomly rotated across all rating questions. | |
A. Overall Performance | |
To begin with, all respondents were asked to rate each university based on their perception of its overall performance, while taking its reputation, quality of teaching staff, research performance, facilities, performance of alumni and students into consideration. Results revealed that HKU received the top mean score of 7.68 as rated by 851 respondents. The next was CUHK with an average score of 7.43rated by 846respondents. In terms of perceived overall performance, HKU and CUHK can be taken as occupying the first tier. The next tier comprised of UST (6.76) and PolyU (6.71), the mean scores of both being almost the same. | |
| Average | Standard error | No. of raters | Recognition(No. of raters/ total sample) | |
| 1. HKU | 7.68 | 0.06 | 851 | 84.9% |
| 2. CUHK | 7.43 | 0.05 | 846 | 84.4% |
| 3. UST | 6.76 | 0.05 | 799 | 79.7% |
| 4. PolyU | 6.71 | 0.05 | 818 | 81.6% |
| 5. BU | 6.24 | 0.05 | 806 | 80.4% |
| 6. CityU | 6.05 | 0.06 | 758 | 75.6% |
| 7. HKIEd | 5.74 | 0.06 | 673 | 67.2% |
| 8. Lingnan | 5.38 | 0.06 | 722 | 72.1% |
B. International Recognition | |
The second attribute tested in this survey was the perceived international recognition of each university, that is, how famous it was across the globe. HKU again received the highest score of 7.73 (rated by 825 respondents), followed by CUHK, UST and PolyU, attaining mean scores of 7.26, 6.54 and 6.40 respectively. | |
| Average | Standard error | No. of raters | Recognition(No. of raters/ total sample) | |
| 1. HKU | 7.73 | 0.06 | 825 | 82.3% |
| 2. CUHK | 7.26 | 0.05 | 815 | 81.3% |
| 3. UST | 6.54 | 0.06 | 764 | 76.2% |
| 4. PolyU | 6.40 | 0.06 | 786 | 78.4% |
| 5. BU | 5.76 | 0.06 | 764 | 76.2% |
| 6. CityU | 5.51 | 0.06 | 748 | 74.7% |
| 7. HKIEd | 5.08 | 0.07 | 711 | 71.0% |
| 8. Lingnan | 5.00 | 0.06 | 731 | 73.0% |
C. Quality of Teaching Staff | |
Regarding the perceived quality of their teaching staff, HKU, again, received the highest rating with a mean score of 7.62 (from 687 raters), followed closely by CUHK at 7.35 (from 683 raters). UST and PolyU formed the next tier with mean scores of 6.84 and 6.67 respectively. However, it is worth mentioning that the recognition rates of this aspect (60%-69%) were relatively lower than those described before. In other words, a larger proportion of people could not give definite answers in this aspect. In fact, other than the two core attributes described before, the other core attributes, in general, have relatively lower recognition rates. | |
| Average | Standard error | No. of raters | Recognition(No. of raters/ total sample) | |
| 1. HKU | 7.62 | 0.06 | 687 | 68.6% |
| 1. CUHK | 7.35 | 0.05 | 683 | 68.2% |
| 1. UST | 6.84 | 0.06 | 641 | 64.0% |
| 1. PolyU | 6.67 | 0.06 | 662 | 66.1% |
| 1. BU | 6.07 | 0.06 | 642 | 64.1% |
| 1. CityU | 5.93 | 0.06 | 614 | 61.3% |
| 1. HKIEd | 5.68 | 0.07 | 596 | 59.5% |
| 1. Lingnan | 5.51 | 0.07 | 606 | 60.5% |
D. Research Performance | |
The universities' research performance was another attribute that the public was not that familiar with. Of those who had an idea, HKU again had the highest score of 7.30 (from 673 raters). CUHK was a bit behind with a mean score of 7.21 (from 668 raters), followed by UST and PolyU at some distance (6.80 and 6.46 respectively). | |
| Average | Standard error | No. of raters | Recognition(No. of raters/ total sample) | |
| 1. HKU | 7.30 | 0.06 | 673 | 67.2% |
| 2. CUHK | 7.21 | 0.06 | 668 | 66.7% |
| 3. UST | 6.80 | 0.04 | 631 | 63.0% |
| 4. PolyU | 6.46 | 0.07 | 632 | 63.1% |
| 5. BU | 5.81 | 0.07 | 615 | 61.4% |
| 6. CityU | 5.76 | 0.07 | 601 | 60.0% |
| 7. HKIEd | 5.30 | 0.08 | 570 | 56.9% |
| 8. Lingnan | 5.22 | 0.07 | 578 | 57.7% |
E. Facilities | |
In terms of facilities, the ranking of the top three positions was slightly different. In the eyes of Hong Kong people, the university with the best facilities was again HKU with a score of 7.46 (from 676 raters), whereas UST scored 7.43 (from 656 raters). Taking the standard error into consideration, the difference was statistically insignificant. For that reason, both HKU and UST are perceived to have the best facilities among all local universities. | |
| Average | Standard error | No. of raters | Recognition(No. of raters/ total sample) | |
| 1. HKU | 7.46 | 0.05 | 676 | 67.5% |
| 2. UST | 7.43 | 0.06 | 656 | 65.5% |
| 3. CUHK | 7.25 | 0.06 | 666 | 66.5% |
| 4. PolyU | 6.71 | 0.06 | 653 | 65.2% |
| 5. CityU | 6.08 | 0.06 | 604 | 60.3% |
| 6. BU | 6.08 | 0.06 | 624 | 62.3% |
| 7. HKIEd | 5.71 | 0.07 | 545 | 54.4% |
| 8. Lingnan | 5.56 | 0.06 | 565 | 56.4% |
F. Quality of Students | |
The last core attributed rated in this survey was the perceived quality of students in each university. Results have found that, students of HKU and CUHK (both mean scores were 7.02) outperformed others and were viewed as the best. The next tier belonged to the students at UST and PolyU, who attained average scores of 6.54 and 6.49 respectively. | |
| Average | Standard error | No. of raters | Recognition(No. of raters/ total sample) | |
| 1. HKU | 7.02 | 0.06 | 724 | 72.3% |
| 1. CUHK | 7.02 | 0.06 | 702 | 70.1% |
| 3. UST | 6.54 | 0.06 | 658 | 65.7% |
| 4. PolyU | 6.49 | 0.06 | 700 | 69.9% |
| 5. BU | 6.16 | 0.06 | 658 | 65.7% |
| 6. HKIEd | 5.94 | 0.07 | 607 | 60.6% |
| 7. CityU | 5.90 | 0.06 | 636 | 63.5% |
| 8. Lingnan | 5.63 | 0.06 | 631 | 63.0% |
G. Relative Strengths and Weaknesses | |
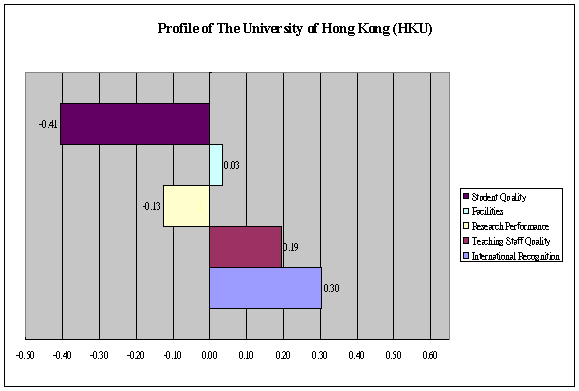
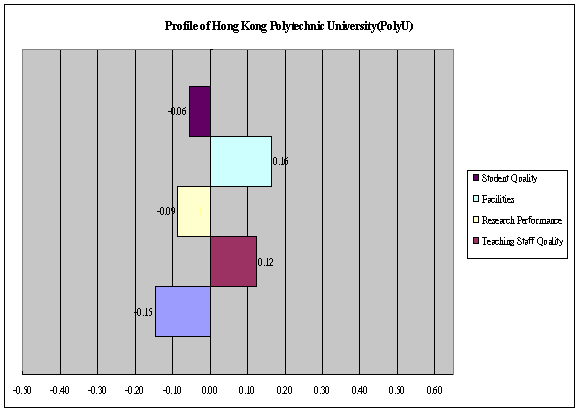
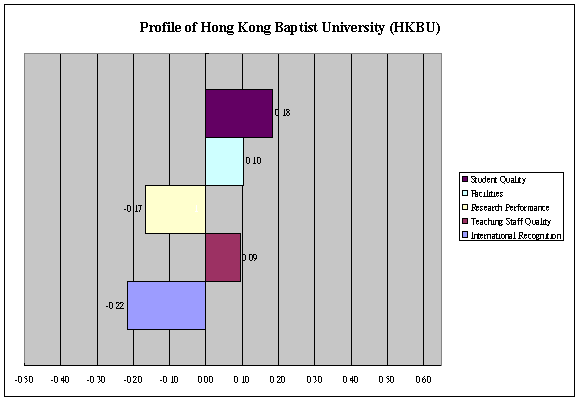
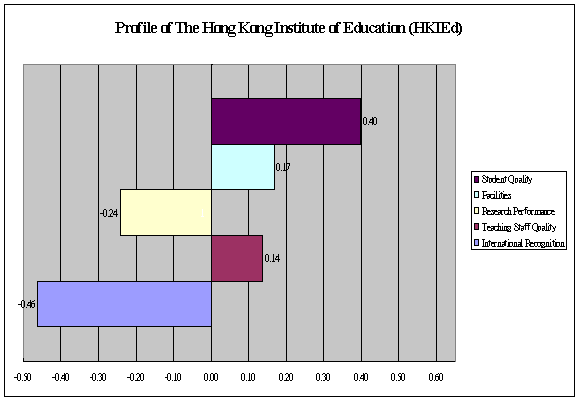
As a collective analysis, the average scores attained by each university regarding five of the above attributes (excluding the overall performance rating) were used to produce a relative strength-and-weakness profile. As shown from Charts 1 to 8 below, all attributes with positive values (presented on the right side of the chart) represent the relative strengths of each university. Conversely, negative attributes (on the left of the chart) refer to its relative weaknesses. And the value denotes the net difference between the average score of that particular attribute versus the overall average of the five attributes obtained by the university concerned. | |
Further analyses have found that the top two local universities, namely HKU and CUHK, were perceived to have very similar strengths (international recognition, teaching staff quality and facilities) and weaknesses (student quality and research performance) as reflected from the pattern of their profiles. | |
Whilst UST and PolyU seem to have formed another kind of profile with facilities standing out as one of strengths, which is especially true for UST. Having quality teaching staff is another strength for both. On the other hand, the profiles for the remaining four universities, namely BU, CityU, HKIEd and Lingnan (in alphabetical order), are found to be highly comparable with student quality, facilities, and teaching staff being their relative strengths. From this analysis, their international recognition is apparently their weakest area. | |
Chart 1

Chart 2

Chart 3

Chart 4

Chart 5

Chart 6

Chart 7

Chart 8

H. Non-core Attributes | |
Other than the six core attributes mentioned, another five non-core attributes were evaluated by means of a nomination instead of rating system. All respondent were asked to name one university which was perceived to have the best campus environment, learning atmosphere, transparency to the community, the best candidate for employers' choice, and having the most approachable Vice-Chancellor/President. | |
The effect of using this nomination system is that responses tend to concentrate on the top choices, and the real difference among the lower ranking institutions may be magnified and polarized. Since only one choice was offered for each question, the ranked order of those at the lower end of each ladder may not be meaningful. | |
With respect to the scenery, design and comfort of the campus, nearly 38% of the respondents was ranked UST (38%) to be the best, 21% opted for CUHK, and 12% opted for HKU (Table 7). Regarding the learning atmosphere, 30% chose HKU to be the best, 24% chose CUHK, and 11% chose UST (Table 8). A similar pattern was obtained when respondents were asked to nominate the university demonstrating the highest level of transparency in dealing with the external parties: HKU (18%), CUHK (16%) and then UST (11%). However, a high proportion of the respondents, 41%, claimed ignorance in this aspect (Table 9). | |
As on the popularity of graduates, the majority of the respondents, 60%, believed that HKU graduates would be the first choice of most local employers (Table 10). Regarding the quality of the Vice-Chancellor/President, Prof. Arthur Li Kwok-cheung of CUHK was perceived to be the most approachable, as 16% of the respondents made this choice. However, it should be noted that as high as 63% of the respondents found it difficult to answer this question (Table 11). | |
| Frequency | Percentage | |
| UST | 381 | 38.3% |
| CUHK | 213 | 21.4% |
| HKU | 119 | 12.0% |
| PolyU | 23 | 2.4% |
| Lingnan | 17 | 1.7% |
| HKIEd | 13 | 1.3% |
| CityU | 12 | 1.3% |
| BU | 8 | 0.8% |
| Don't know/ Hard to say | 207 | 20.8% |
| Total | 993 | 100.0% |
| Frequency | Percentage | |
| HKU | 294 | 29.7% |
| CUHK | 235 | 23.8% |
| UST | 109 | 11.0% |
| PolyU | 43 | 4.3% |
| HKIEd | 13 | 1.3% |
| CityU | 11 | 1.1% |
| BU | 10 | 1.0% |
| Lingnan | 4 | 0.4% |
| Don't know/ Hard to say | 272 | 27.5% |
| Total | 990 | 100.0% |
| Frequency | Percentage | |
| HKU | 180 | 18.3% * |
| CUHK | 154 | 15.7% * |
| UST | 111 | 11.3% |
| PolyU | 61 | 6.2% |
| CityU | 35 | 3.5% |
| BU | 21 | 2.2% |
| Lingnan | 11 | 1.1% |
| HKIEd | 6 | 0.6% |
| Don't know/ Hard to say | 406 | 41.3% |
| Total | 984 | 100.0% |
| Frequency | Percentage | |
| HKU | 593 | 59.8% |
| CUHK | 108 | 10.8% |
| UST | 59 | 5.9% |
| PolyU | 53 | 5.4% |
| BU | 8 | 0.8% |
| CityU | 6 | 0.6% |
| HKIEd | 2 | 0.2% |
| Lingnan | 1 | 0.1% |
| Don't know/ Hard to say | 162 | 16.3% |
| Total | 993 | 100.0% |
| Frequency | Percentage | |
| CUHK - Prof Arthur K.C. Li | 158 | 16.3% |
| UST - Prof. Chia-Wei Woo | 54 | 5.6% |
| Lingnan - Prof. Edward K.Y. Chen | 44 | 4.5% |
| HKU - Prof. W. I. R. Davies | 40 | 4.1% |
| BU - Dr. Daniel C.W. Tse | 21 | 2.2% |
| CityU - Prof. H.K. Chang | 17 | 1.8% |
| PolyU - Prof. Chung-kwong Poon | 17 | 1.7% |
| HKIEd - Prof. Ruth Hayhoe | 7 | 0.8% |
| Don't know/ Hard to say | 610 | 63.0% |
| Total | 969 | 100.0% |
I. Respondents' Interest in Overseas Studies | |
The last part of the survey requested the respondents, irrespective of their age and their education attainment, to opine whether they were interested in overseas studies, and if yes, where. Of all the respondents interviewed, only 25% expressed interest in studying aboard (Table 12), among whom 40% would like to go to the U.S.A. The second most popular country for overseas studies was England, followed by Canada and Australia (Table 13). | |
| Frequency | Percentage | |
| Yes | 251 | 25.1% |
| No | 751 | 74.9% |
| Total | 1,002 | 100.0% |
| Frequency | Percentage of respondents(Base = 249) | Percentage of total sample(Base = 1,002) | |
| U.S.A. | 101 | 40.4% | 10.1% |
| England | 67 | 26.8% | 6.7% |
| Canada | 31 | 12.3% | 3.1% |
| Australia | 27 | 10.8% | 2.7% |
| China | 6 | 2.4% | 0.6% |
| Japan | 4 | 1.5% | 0.4% |
| New Zealand | 2 | 0.9% | 0.2% |
| Others | 4 | 1.6% | 0.4% |
| Don't know/ Hard to say | 8 | 3.2% | 0.8% |
| Total | 249 | 100.0% |


